
Those with any interest in policy issues that matter to New Zealand’s economic future know that we have an ageing population; that there will soon be twice the number of pensioners as now, with bigger increases in the number of ‘old old’ with concomitant increases in health costs. All this provokes calls for changes to New Zealand Superannuation, more self-provision and, despite the results of the 1997 Referendum, even suggestions that KiwiSaver be made compulsory.
There is no doubt that costs will increase if current policy settings persist and that’s why the Treasury has recently published a slew of papers giving its and others’ views on some of the fiscal challenges over the next 50 years.
The main 2013 report is called Affording Our Future: Statement on New Zealand’s Long-term Fiscal Positionaccessible here. Although New Zealand’s fiscal environment has improved in the last four years, the Treasury is justifiably concerned about our fiscal future.
For the last 14 years, the Treasury has run a model as part of its oversight of the New Zealand Superannuation Fund, its currently suspended contributions and what difference the NZSF might eventually make to the government’s fiscal position.
What follows looks at two extracts from the 14 versions of the NZSF model: the expected net costs of NZS over periods to 2050 (assuming no changes to the current NZS benefit) and expected GDP in each of those years. The chart shows the 14 projections:
Cost of NZS as percentage of GDP – 14 Treasury models 2000-2013
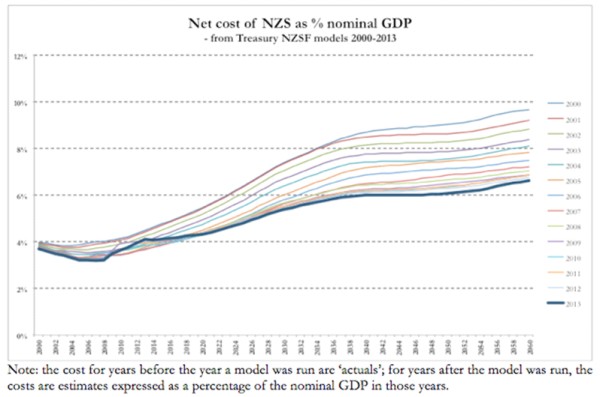
It’s easy to dismiss such estimates – it’s all too far away; the outcomes are driven by the guesses and how meaningful can they really be to policymakers today? However, the chart has some powerful messages and it’s important to understand those.
1. Reducing real cost: measured against estimates of the size of contemporary economic output (GDP), the real estimated cost of NZS in 2060 is reducing. Between 2000 and 2013, the 2060 point fell from an estimated net 9.7% of GDP in 2000 to 6.6% in 2013, an apparent reduction of 32% in 13 years. The most recent 2013 estimates are lower than all previous 13 estimates from 2021 onwards.
2. Latest estimate: The 2013 estimate sees the net cost of NZS (currently 4.1% of GDP) increasing to 6.6% by 2060 (+61%). That is still a large increase but it is modest by comparison with the pension challenges faced by many countries.
3. Other countries: International comparisons aren’t easy1 but the table shows a selection of 2010 and 2060 estimates by the OECD of public expenditure on pensions:
Table: Projections of public expenditure on pensions 2010 & 2060 (as % GDP)
| 2010 | 2060 | 2010 | 2060 | ||
| Austria | 14.1% | 16.1% | Korea | 0.9% | 6.5% |
| Belgium | 11.0% | 16.6% | Netherlands | 6.8% | 10.4% |
| Canada | 5.0% | 6.2% | Norway | 9.3% | 14.2% |
| Denmark | 10.1% | 9.5% | Portugal | 12.5% | 12.7% |
| France | 14.6% | 15.1% | Spain | 10.1% | 13.7% |
| Germany | 10.8% | 13.4% | Sweden | 9.6% | 10.2% |
| Greece | 13.6% | 14.6% | United Kingdom | 7.7% | 9.2% |
| Ireland | 7.5% | 11.7% | United States | 4.6% | 4.7% |
Source: OECD Pensions Outlook 2012, p.210. The table shows gross costs which in many cases are the same as net costs. It ignores countries for which 2060 information was not supplied.
Of the 31 countries reporting for 2010, only Australia (3.6%), Iceland (4.0%) Korea (0.9%) and Mexico (2.4%) reported a cost less than New Zealand’s net 4.1%.
By 2060, of the 25 OECD countries reporting, only Canada, Korea and the United States expect public pension expenditure to be less than New Zealand’s 6.6%. In fact, of the 31 countries reporting for 2010, 23 of them already pay more in 2010 than the net cost New Zealand expects to pay in 2060. The OECD 28 country average for 2010 was 9.3%.
This is not to dimish the challenge of a 61% increase in the net cost of NZS over the next 50 years but rather to place that in an international context.
4. Nominal vs. real cost: The estimated nominal cost of NZS, according to the 2013 NZSF model’s projections increases 14-fold between 2010 and 2060 but GDP is expected to increase 8-fold over the same period. That is the main point of this article.
New Zealand Superannuation is in fact a claim by today’s pensioners on today’s economic output. In simple terms, it represents a transfer of the ability to consume resources from today’s producers to today’s older consumers. The transfer mechanism is higher income taxes than would otherwise be the case if we didn’t have NZS.
The same will be true in 2060. This analysis emphasises the importance of economic output and, for the security of today’s and tomorrow’s pensioners, the importance of increasing that output at a faster rate than the latest version of the NZSF model presently projects. For many more reasons than just the affordability of NZS, how to make New Zealand more productive should be at the centre of discussions about the economic implications of an ageing population.
To describe the Treasury’s release as a “frightening paper …on New Zealand’s fiscal future” (SundayStar Times, 11 August 2013) is alarmist nonsense. An ageing population presents challenges for future governments but the information presented in the Treasury’s 2013 report is not new and indeed is somewhat more comforting in 2013 than it was in 2000. That continues the trend that the Chart above illustrates for all 13 of the NZSF models after the first in 2000.
However, New Zealand needs to start a conversation about what NZS might look like in, say, 2060 and beyond. Older groups in our population will be making larger total claims on the country’s economic output. That should put New Zealand’s expected growth at the centre of the discussions we need to have, for example, about the size of the New Zealand Superannuation pension, the age from which it becomes payable (the ‘state pension age’), the qualification conditions and the basis on which it is protected against inflation. Those are not the only things New Zealand needs to discuss in relation to future retirement incomes.
Despite the political blood that has been spent on superannuation issues over the last 30-40 years, there has never been a research-led discussion on the size and shape of NZS.
That needed debate will try to predict the reaction of voters in 2060 to the amounts needed to meet the 2060 cost of NZS. New Zealand may conclude today that a net 6.6% of GDP will be acceptable to 2060 voters, in which case the NZS pension itself doesn’t need to change. However, if those 2060 voters decide that, say, 5.5% was preferable, the benefits can be cut relatively quickly to bring that cost down. A one-sixth reduction in the annual pension would do the trick and that could happen overnight.
No matter what 2013 voters decide, 2060 voters will have the final say. If today we expect that a net 6.6% might be too much then pensioners who will be alive in 2060 need as much notice as practicable. While they are working, they can save to replace the shortfall in their total retirement incomes.
That’s why the research and the needed conversation needs to start now.
- What counts as “public expenditure” leaves out tax breaks for private provision and also usually ignores tax on the public pensions themselves. In Australia, for example, the cost to taxpayers of incentives for retirement saving is close to the amount the state spends on the Age Pension itself. ↩