
You have seen the headlines – something is happening to home-ownership rates in New Zealand and it’s seemingly not good news. According to Census data, the proportions of New Zealanders who owned the home they lived in hit a peak in 1991 and have fallen, as measured by the five-yearly Census data in both 2001 and 2006. For example:
“The year 2006 marked the third successive New Zealand census in which rates of home ownership have fallen: 72.4 percent of all private dwellings were owned by their occupants in 1991, 70.7 percent in 1996, 67.8 in 2001 and 66.9 in 2006.” (On the falling rate of home ownership in New Zealand, Philip Morrison, Centre for Housing Research, Aotearoa New Zealand, 2008)
The 2013 Census may confirm that trend but is that what’s really happening?
We don’t really know.
In May this year, the Retirement Policy and Research Centre (RPPC) published a PensionBriefing: Census 2013 – shortcomings in questions about housing. It suggests that trends in home-ownership rates are less clear than many claim and may even have been relatively unchanged in the 30 years 1976-2006.
The PensionBriefing analyses the 2006 Census housing tenure questions in detail. They were the same questions as those used in the recently completed 2013 Census.
The 2006 Census was the first concerted effort to understand the impact of family trusts on the pattern of home ownership though there had been earlier attempts.
However, there were gaps in those 2006 questions that the RPRC’s PensionBriefing describes in detail. Despite statutory promises of confidentiality, we must expect reluctance from Census respondents to supply information about tax or estate planning arrangements associated with family trusts. Gaps in the questions asked create gaps in the data gathered but also create opportunities for respeondents to be less than forthcoming.
Unoccupied dwellings
The first shortcoming with the 2006 Census (and with all Censuses carried out since 1991) is that there is no attempt to gather information about dwellings that were unoccupied on Census night. We know how many there were in 2006 (159,276 or 9.9% of total dwellings) but not why they were unoccupied. The 1986 and 1991 Censuses were the last to wonder why: twenty or so years ago, 37.5% of unoccupied dwellings were holiday homes and the usual occupier was away in respect of a further 30.5%. So on Census night in 2006, about two-thirds of unoccupied homes (108,300 dwellings) may have been owned by households and about half of those may have been usually occupied by the owners who happened to be away from home on the night.
The first conclusion about Census 2006 then is that we do not know about the ownership status of about one tenth of all dwellings.
Nor do we have any information about the facilities in those unoccupied dwellings. The Dwelling form asks about the style of building, number of floors, number of rooms, number of bedrooms, heating arrangements, phone services and the number of motor vehicles associated with the dwelling. This is unconnected to the ownership question but, if we think it’s important to have this information about occupied dwellings, we should attempt to find out about the one tenth of all dwellings that were unoccupied on Census night.
Occupied dwellings
The position is not a lot better for the 90.1% of all dwellings that were occupied on Census night in 2006.
In sumary, the 2006 Census data show that, of all occupied dwellings on Census night:
– 51.2% were ‘owned or partly owned’ by occupiers;
– 26.7% involved ‘rent payments’ by occupiers, and
– 11.6% were ‘held in a family trust’.
Total 89.4% of occupied dwellings accounted for
That left 10.6% or 154,000 occupied dwellings where the relationship between owner and occupier in 2006 is unknown. That gap is not a new phenomenon.
Census-based data supplied to me by Statistics New Zealand in 2004 showed that trends in ‘rented’ and ‘owned with or without a mortgage’ created a gap (dubbed ‘other’) that rose from 0.5% of occupied dwellings in 1981 to 9.4% in 1996 before dropping back to 7.6% in 2001. We do not have direct access to the 2006 data but the rise from 7.6% in 2001 to 10.6% in 2006 may be explained by the more detailed information requested on family trusts in 2006, and the gaps in those questions that we have described.
What was striking about the 2004 Statistics New Zealand data was that the ‘other’ category had been less than 1% of occupied dwellings for the 65 year period 1916 to 1981. That changed dramatically over the following 25 years.
Commentary on data
We know that 9.9% of all dwellings on Census night were unoccupied and we do not know who owned them. We also do not know about the ownership status of a further 10.6% of occupied dwellings (9.5% of all dwellings).
In total, we cannot account for the ownership/occupancy arrangements for 313,300 dwellings which is 19.4% of all dwellings in 2006.
These gaps mean we cannot draw too many conclusions about home-ownership rates from Census data. The most we can say is that we know 911,913 or 56.5% of all dwellings were owned or partly-owned by occupiers or ‘held in a family trust’.
There were also gaps in data supplied by respondents who said they were ‘renters’. A total of 31.1% of occupied dwellings (452,200 dwellings) said the dwelling was ‘not owned by usual residents’ but 4.4 percentage points of those respondents (for 64,000 dwellings) gave no information about rental arrangements or said there was no rent. Respondents for the remaining 26.7% of all occupied dwellings (388,300) specified the weekly rent paid. We can probably assume that these rent-payers were arms-length occupiers.
If rent-payers have no connection to the owners, home ownership rates may possibly be deduced from the numbers of households who say they are paying rent and who specify the amount paid.
‘Rent payers’ were 49.3% of occupants in the 1936 Census – the proportion has about halved over the following 70 years.
However, of particular note is that the proportion of ‘rent-payers’ has been relatively flat over the 30 years 1976-2006, as the chart shows:
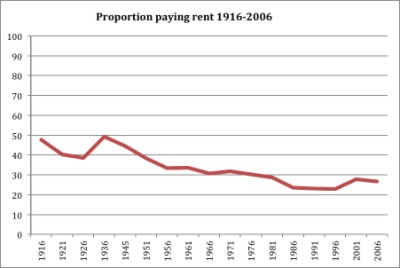
It seems difficult to construct a story about falling home-ownership rates from this chart. If home-ownership rates were really falling, we should expect rising, rather than relatively flat rent-paying occupancy rates over the 30 years between 1976 and 2006. Rent-payers were 30.3% of occupied dwellings in 1976. Since then, rent-paying rates ranged from 22.9% to 28.6%. The 2006 rate was at the mid-point of the 30-year range of +3.6 percentage points.
Will the 2013 data be better?
When the 2013 Census results are published later this year, they will have the same difficulties that were apparent with the 2006 data analysed above. That’s because the questions in 2013 were the same as in 2006.
If we really want to know the ownership status of all dwellings and the relationship between owners and occupiers; even the facilities offered in unoccupied dwellings on Census night, the questions for the next Census, provisionally scheduled for 2018, need changing.
The RPRC’s PensionBriefing concludes:
“The full influence of family trusts on the ownership status of homes cannot be deduced from the porous set of questions in the 2006 Census, now repeated in 2013. There are too many gaps in the Census results to draw any particular conclusion about home ownership trends.”
The full PensionBriefing is available here.