
This paper is in three sections. The first is a paper I wrote examining in detail claims made in a report by the Royal Society of New Zealand in 2016 on transitioning New Zealand to a low carbon economy. Three of 46 recommendations made sense both economically and environmentally, eight made no difference to either and all the others were detrimental to the New Zealand economy and/or were ineffective at reducing CO2 emissions. I pointed out the futility of cutting emissions when the Chinese are growing at a much greater rate. (I have discovered more recently that, with their Belt and Road Initiative over the next 30 years, they are about to treble their global emissions footprint which is already at 270 times the New Zealand footprint).
The original paper is only a third of the length of the report I submitted to RSNZ, and that constraint lead to criticisms that to add even more to the paper which was not allowed.
The second section is the correspondence with the editor of the Journal of the Royal Society of New Zealand where I tried to continue the debate. This represents the second round of submission as I was able to identify, by his comments, that one of the first referees was an author of the original report. While the referees thought that the approach to the research was to be lauded, they could not possibly agree with the results, and used the old ruse of nit-picking instead of unravelling the substantive arguments I made – which still stand.
The third section deals with the correspondence with the editor of the Journal of New Zealand Studies with pretty much the same conclusion.
This paper is 2 years old, but I have more empirical data to back up each of the claims I have made.
Part I: My paper dated 29.07.17
DECARBONISING THE NEW ZEALAND ECONOMY: AN ENGINEERING-BASED REALITY CHECK
Michael J Kelly, Department of Engineering, University of Cambridge, Cambridge CB3 0FA and MacDiarmid Institute, Victoria University of Wellington, New Zealand.
Abstract:
The transition of New Zealand to a low-carbon economy has been considered in a recent report by the Royal Society of New Zealand, with a wide range of suggestions of specific actions to achieve that end. Here I review the international context in which carbon dioxide emissions reductions are being undertaken, in the hope that future harmful climate changes will be averted. I look at the international costs of carbon dioxide capture, and argue that New Zealand should not pay ‘over the odds’ for its emissions reductions. I then filter the actions identified in the report through the lenses of (i) the capacity to reduce carbon dioxide emissions, (ii) the value for money, and (iii) the wisdom of New Zealand investing in particular measures. Few of the suggested actions survive this filter: some investments overseas would provide much greater value for money in terms of reduced carbon dioxide emissions on a global scale, and the problem is global.
-
-
Introduction and Setting the Big Picture
-
In April 2016, the Royal Society of New Zealand issued a report ‘Transition to a low-carbon economy for New Zealand’ (http://royalsociety.org.nz/media/2016/06/Report-Transition-to-Low-Carbon-Economy-for-NZ.pdf ) with a large number of proposed actions to reduce the emissions of carbon dioxide. A decision had been taken not to attempt to rank these recommendations in terms of effectiveness or value for money, as there was no literature on the subject (private communication, with thanks, from Professor R Sim FRSNZ, chairman of the working party that produced the report). This paper is intended as a starting point for that literature, and, I hope, the basis for further work to refine and revise the conclusions reached here. A cost-benefit analysis of the proposed actions, viewed as engineering or comparable projects) helps to radically reshape the suggestions made in the report in terms of effectiveness, and indeed provide a triage between those that are of net economic and other benefit to New Zealand, those that are marginal, and those that represent economic folly. The list of the 47 actions is that covered in the Infographics Supplement issued with the Summary Report and the Main Report and keeping to its structure, the actions are listed here under six sectoral headings, (A) energy supply, (B) transport and (C) buildings, (D) industry, (E) agriculture and (F) forest and land use, and three target groupings for action, namely (G) everyone, (H) businesses and (I) central and local government. Most of the 24 actions under the last three headings are repeats, not made here, of the actions in the earlier section.
Many of the actions suggested in the Royal Society report will, in the round, make matters worse, either through adding to CO2 emissions elsewhere, or through driving up costs that allow less to be done that would otherwise be the case. Engineering reality and economic integrity must be at the heart of any projects to mitigate carbon dioxide emissions anywhere in the world, so preventing the uptake of fashionable actions that ‘feel-good’ but actually make matters worse (Kelly 2016). There is already the classic example where a UK government green energy wedge on electricity prices to support solar and wind farms, has driven aluminium smelting off-shore: what was originally gas-fired electricity production of aluminium in the UK has been replaced with coal-fired electricity production in China, with added CO2 emissions in production and in transport round half the world (Merlin-Jones, 2012), exacerbating the actual global CO2 emissions. The UK steel industry is now under threat for the same reason. The price wedge has trebled the level of fuel poverty since 2003 among UK households (http://www.poverty.org.uk/80/index.shtml) and the electricity consumers who are poor are paying disproportionately, effectively reversing many years of progressive tax policies (Tenner 1997).
First, I set the global context of carbon dioxide emissions reductions, and then examine the costs of some actions to set a benchmark of costs: a consulting study (Mackinsey 2010) produced a set of marginal abatement costs as a guide to what actions to undertake first. I then undertake a point-by-point critique of the actions for reducing CO2 and greenhouse gas emissions suggested in the RSNZ report, looking at the scope for making reductions and the likely extra costs associated with making them. This results in a sharp divide between those measures that may be effective and those than won’t. I then look at the effectiveness of spending millions or billions of New Zealand dollars on these actions, and prioritise the scale of these actions. The context here is the competition for scarce New Zealand resources, the level of indebtedness of New Zealand citizens and their capacity to service increased levels of debt, and the relatively greater effectiveness of smaller sums spent abroad in better tackling the problem as globally perceived.
Carbon dioxide emissions are a global phenomenon. The most recent data on ‘carbon dioxide emissions’ on Wikipedia allow an interesting comparison with actions in China and New Zealand: they shown that the per-capita emissions are 6.19t (in 2010 and rising) and 7.22t (in 2010 and falling), while the populations are 1357M and 4.5M respectively. In the year 2009-10 the New Zealand emissions fell by 1M t CO2-eq while the Chinese emissions grew by 556Mt CO2-eq. China’s carbon emissions were about 260 times greater than those of New Zealand in 2010, and have been growing by the total annual value of New Zealand’s emissions every two months since 2000! (Note in the last two years China has curbed its emissions growth, but I estimate that the disparity between the two countries remains of the order of a factor of 275). If Beijing would curb air-conditioning use in summer by turning up the thermostat by 1C, it would save more CO2 than New Zealand emits each year. A sense of this reality must be reflected in decisions on taking actions to mitigate New Zealand emissions.
This paper refers to great swathes of data on particular domestic issues, but it is important to see the global context. BP data shows that global energy demand grew by 40% between 1995 and 2015 (Figure 1(a) of Kelly 2016): 86% of this increase was met by fossil fuels. During that same period the number of the World-Bank-defined middle class (living in a home with running water and electricity, with no mention of mobility or any luxury items (Figure 1(b) Kelly 2016)) rose over the last 20 years from 1.5B to 3B. The 40% rise in energy demand can be explained quantitatively in full if the new middle class people use 3.5 times as much energy per person per day as someone in a rural or urban slum, a not unreasonable estimate. The World Bank predicts a further 2.5B people joining the middle class by 2035, and BP estimate a further increase of 40% in global energy demand for a world economy that has doubled in size, and over 80% of which will be met by fossil fuels. The energy growth is approximately linear with time, with a modest downward curvature being their best estimate of what energy savings and efficiency can produce. Renewables as we know them today will produce 10% of world energy in 2035 (this can be read from the BP data and others have published similar material). To persist with the notion of zero global carbon emissions by 2050 in the face of this real world evidence, and the progress of the last 20 years expanded into the next is to ignore engineering reality. The BP data is well respected across the world and is widely cited, despite its origin.
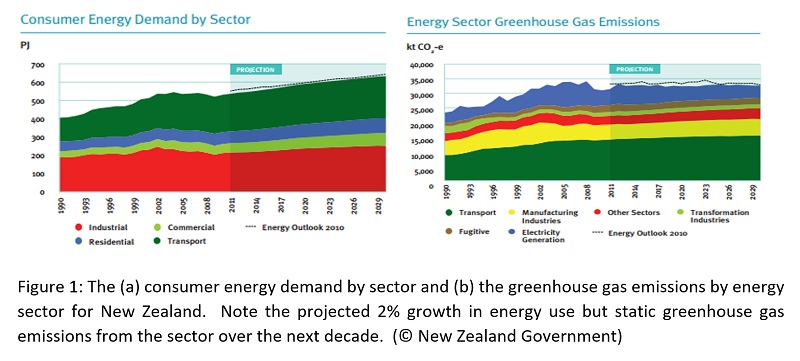
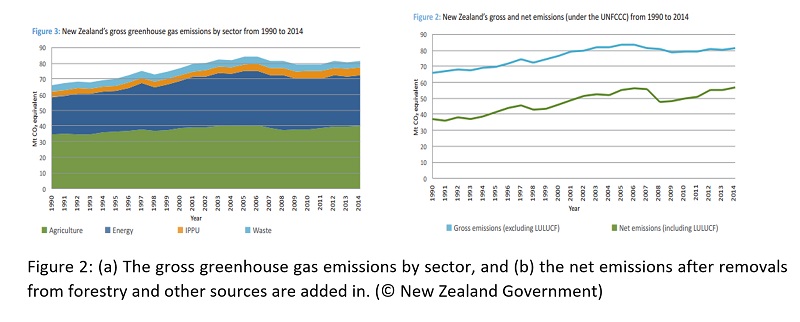
In Figure 1 I present two key diagrams relating to New Zealand (MBIE 2011), namely the consumer energy demand by sector and the greenhouse gas emissions by energy sector from 1990 to the present day, together with projections out to 2029 on a business as usual basis including the present levels of renewable energy introductions. From these we can see the types of energy use driving emissions and we get a sense of the relative as well as absolute scale. This is important, as the aim will be to get the maximum impact in terms of emissions reductions for a given level of investment, rather than adopting a deeply sub-optimal strategy of investments made piecemeal on any possible intervention, as the Royal Society of New Zealand report correctly concluded. The biggest gap in the second diagram is the greenhouse gas emissions from agriculture and land-use, which once land-use and land-use changes and forestry sequestration is included (MFE 2016), more than double CO2 emissions to 80Mt Co2-eq, with net emissions at 55Mt CO2-eq. Both of these are shown in Figure 2. Note that a trebling of reforestation activities would largely eliminate the net greenhouse gas emissions. Note also how small (at 6%) the emissions are from industrial processes and product use (IPPU) (eg, metals, minerals and chemicals), reflecting the strength of the land-use economy: even for the UK which is now a service economy the IPPU figure is 16% (Climate Change Committee, UK 2017).
As a country, New Zealand uses about 2% more energy every year. We could save about 20% of that demand (or $2.4 billion a year) by using energy more efficiently and relying more on renewable resources (Energy Efficiency and Conservation Authority (EECA) 2017). In 2015 New Zealand sourced 40% of its total energy from renewable resources. Most of this was used to produce electricity – the rest was mainly wood fuel used to produce heat for industrial processes and home heating.
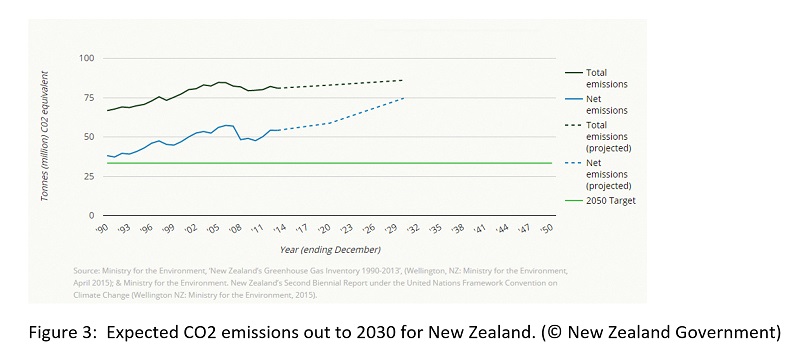
A study of likely further emissions has been undertaken by PureAdvantage (2016) and the results in Figure 3 project a sharp rise in net emissions that in turn is based on a modest rise in total emissions accompanied by a fall in carbon sequestration by forests over the next decade, presumably from the level of harvesting being greater than the rate of reforestation.
-
Carbon Capture and Sequestration
Most of the man-made carbon dioxide emissions in the world come from power stations, fossil fuel production and logistics, industrial processes and transport. (Wikipedia: greenhouse gas 2017)
In a recent study (Scott 2015), it was shown that carbon-capture and storage adds a penalty to the overall energy output efficiency of a coal-fired turbine of at least 16%, taking a present state-of-the-art 45% efficient coal-fired steam turbine back to 29% efficiency, a value typical of such plants 60 years ago. The economic penalty of that reversal is unsustainable which is why there is no large-scale take up in the EU, and early experiments in Norway are stalled. Globally only about 20Mt CO2-eq are captured and sequestered out of 51Gt CO2-eq produced yearly at energy plants (0.4%): the CO2 is pumped back into the ground to enable extra gas or oil to be extracted from well-heads. Sequestration at the scale needed is an unproven technology (Kelly 2016).
The typical costs of capturing CO2 is estimated at US$60-90/tonne from gas flues in the global power sectors (Wikipedia: carbon capture and storage, 2017), but there are rumours of a new solvent (Indian Report 2017) that might reduce this cost by a factor of three. A recent report (Service 2016) from the Materials Research Association suggests a figure of £20/tonne by 2025. If this eventuates, it sets the benchmark cost against which other means of saving CO2 emissions are to be measured. Until this method of carbon capture is exhausted globally, discretionary spending should be pushing this cheapest option to global completion before adopting needlessly expensive alternatives. If we discover project costs of capturing CO2 in New Zealand exceed $100 per tonne now, and not falling by a factor of 3-4 by 2025, we are misinvesting if the reduction of carbon dioxide emissions is the primary purpose of the project. Most of the options considered in the next section fail this test.
-
Analysis of Decarbonisation Measures in the New Zealand Context
In this section I concentrate on 23 recommendations made in the Royal Society of New Zealand report as they impact six sectors: energy, transport, buildings, industry, agriculture and forestry/land-use. A much fuller unpublished version of this section is lodged with the Royal Society of New Zealand. I emphasize that the analysis here is in terms of engineering (and other) projects to reduce the CO2 emissions over the next two decades, and not a century long discounted analysis of present investments. That is for someone else to perform. Note that any project has to pass an engineering integrity test, otherwise we are rebuilding the Tower of Babel.
3.A: Energy Supply
3.1: Increase the share of renewable electricity to meet the 90% target by 2025
What will this mean in terms of carbon emissions? During 2005-13 there has been a 19% reduction in CO2 emissions from the electricity sector from 7.1 to 5.7 Mt CO2-eq, a drop equal to 1.5% of all CO2 emissions (MBIE 2013). This came from reducing the use of coal and natural gas. The difference between 80% and 90% renewables is 2Mt CO2 equivalent. If these trends continued, we would get to 90% renewables by 2025: this is likely as there is still coal used at Huntly and this may close in 2022 (a postponement from 2018 in acknowledgement of it being virtually the only insurance against dry years (Radio NZ 2017)), saving about 0.6Mt of coal or 2.2Mt CO2 eq. If all lost production is replaced by natural gas the CO2 saving figure becomes 1.1Mt CO-eq, but that figure grows towards 2.1Mt CO2 as a greater fraction of lost electricity is made from geothermal energy. This will come without any further public intervention. A campaign to encourage changes in behaviour patterns (as per section 5 below) will help ensure that the 90% target is exceeded by 2025, or met if the usage trend assumption made above fails to hold. Using the benchmark figure of $100 per tonne of CO2 saved, an expenditure of $200M would be justified on the progress to 90% renewables in terms of saving CO2 alone, a figure that could reduce to $40M by 2025. Note here that wind and solar renewables are not needed to play a role in meeting the target. Wind energy installation (Wind Energy Association 2012) has stalled over the last 5 years because of low prices in the spot market, and static electricity demand).
The poor performance in energy terms and the deleterious effect of the intermittency of solar and wind sources on the overall electricity supply system in terms of additional systems cost to guarantee security of supply has an extensive literature of its own (See Kelly 2016).
3.2 Expand the uptake of bioenergy (wood, biogas etc.) to displace coal for providing heat
The trends in the energy usage in households show that in 2013, electricity was used for heating in 79.2 percent of occupied private dwellings, up from 74.8 percent in 2006, and 72.0 percent in 2001 (NZ Stats 2013). Since only 4% of households were still using coal in 2013, and that number halved since 2001, the trend will eliminate home coal use by 2025. There are other trends – a rise in electrical heating, falls in gas and wood usage, and a very small rise in no heating at all. The actual consequential CO2 savings are nugatory from further action on biofuels to replace coal.
This leaves the use of bioenergy to replace coal in industry for heating. MBIE data (2016) indicates that 26PJ out of 571PJ (4.5%) of total energy used in New Zealand was from all industrial uses of coal. Of that 22.5PJ is used in food processing, and 4.5PJ in extracting non-metallic minerals. Where coal is used as high-grade heat, as in mineral extraction, the cost of electric furnace alternatives may present a problem, but this should be examined further for steel production. The case for weaning food processing off coal seems much stronger, but the sunk costs of, for-example, coal-fired milk driers are large, and the absence of a suitable local alternative fuel would add further to costs of replacement.
The logic of the combined heat and power plant at Kinleith is clear – the heat is used, along with electricity, at the local paper making mill so there is no piping heat over long distances. The advantages of combined heat and power systems and biofuels in Sweden is for combinations of reasons not applicable in New Zealand. The major use of the heat output in Scandinavia is district heating where the pipework is of order $1M/km and so is confined to use in dense cities which New Zealand does not have, and is most important in winter which is much more severe and longer there than in New Zealand.
The remainder of this section summarises further insights on biomass coming from a 2007 NIWA study on the matter, which focused mainly on technology limitations, but it was prescient in admitting uncertainty about fossil fuel prices which rose sharply through to 2014 and then dropped even more sharply thereafter. The key conclusions were that • All available biomass residues combined would meet only ~10% of New Zealand’s current energy demand. • Woody biomass is the bulk of this material. • Purpose grown crops will be required to meet a larger proportion of New Zealand’s energy demand. • Steep hill country will need to be used for growing this extra biomass to avoid conflict with agricultural production. • The only viable biomass crop for steep lands is forests, which have additional uses, environmental benefits and can act as a significant energy store. • Research is required on a range of conversion technologies to improve their economic viability, as well as forest and agricultural crops and algal systems.
3.3 Improve the efficiency of existing electricity generation plants and turbines
This is a tricky topic to quantify as we have to look at the present efficiency of plant, the scope for improvements, and the economics of that improvement compared with closure or mothballing, on a case by case basis. In practice some coarse graining is necessary. Improving the turbines for hydroelectricity will have a small 2-3% efficiency gain and a negligible reduction of CO2 emissions: decisions on upgrades will be made on hydro-engineering and economic grounds only, so it is only the others we need consider. Indeed, from the data in (3.1) above, it is really only the 16% of electricity generated by gas, 12% by geothermal and 3% by coal that needs consideration. The share of gas-fired electricity has been decreasing since 2012, contributing to the sharp drop in CO2 emissions.
New Zealand geothermal energy comes with an average CO2 emissions of 100g/kWh electricity production. This compares with 900-1000 g/kWh for oil and coal-fired plants or 400 g/kWh for gas-fired combined cycle plants (NZ Geothermal Association 2013). This means that the CO2 from geothermal energy in New Zealand is already a small fraction of the total for electricity, and not worth chasing as part of an 80% reduction of CO2 emissions for New Zealand in comparison with actions described below. The energy penalty for carbon capture above comes from the thermodynamics of taking the 16% of CO2 out of the exhaust gas flow, and this would apply to geothermal power stations as well (scale because of the lower CO2 concentrations): there is an extra cost associated with sequestration, but it is thought to be no more than a third of the capture costs: finding suitable sites is a serious problem.
Most of the hydropower stations in New Zealand have turbine efficiencies between 90 and 94%, generator efficiencies of 98% or better and hydraulic losses amounting to 5 to 10%. Hence there is very little opportunity for a substantial increase in overall efficiency. Many of the stations have been upgraded recently and are as efficient as they can be made with modern technology. (These three sentences provided in a personal communication by Bryan Leyland, author of Small Hydroelectric Engineering Practice). In terms of the high cost per tonne of CO2 emissions saved, the replacement of smaller turbines with more efficient ones of the same size would not be justified on this ground alone.
3.4 Increase shares of renewable electricity towards 100% through more flexible smart grids and demand-side management.
The move from 90% to 100% renewables for electricity generation might be possible in normal years but it is virtually impossible in dry hydro years because a dry year reduces New Zealand generation by about 10% and the shortfall can only now be guaranteed by gas or coal fired generation. The great advantage of geothermal energy is that it is not intermittent, as is wind and solar. The social contract with electricity suppliers is energy-on-demand, and that becomes impossible with a large penetration of intermittent sources of energy, without putting extra pressure on the hydro-generation in terms of close load balancing, where intermittency variability is added to demand variability to be coped with: the former is much more demanding than the latter, and this adds to costs in terms of shorter turbine lifetimes. One cannot let intermittency exceed about 20% of the total without needing expensive back-up measures to guarantee supplies (UKERC 2006). The case for the extra costs of smart grids to enable demand-side management only makes economic sense where fossil fuels dominate the sources of electrical energy. In the New Zealand case there are much simpler alternatives such as voice frequency signals over electrical wires to coarsely control demand management. The smart grid is expected to give suppliers the power to control electricity supplies, such as turning off electric water heaters and fridge-freezers at half-time and full-time of major sports events to cover for the surge in demand from electric kettles. This in turn offers suppliers much better use of the distribution system because they no longer have to cover the full impact of the surge from available generation and transmission: and that case can be made within the suppliers’ own operations, and not in consideration of CO2 emissions reductions, until the value of the latter is much higher than now. It is unfortunate that electricity industry regulations do not encourage limiting peak demand. Sophisticated supply-side intervention would not be necessary if tariff structures better reflected economic costs of production.
If the aim is a CO2 free electricity supply, then the waste CO2 from geothermal stations needs capturing and sequestering as per the last section.
3.B Transport
3.5 Develop infrastructure for cycles and pedestrians
The developing of infrastructure for cycling and pedestrians have a negligible impact on CO2 emissions (just compare the land-area, single storey, usage with the adjacent road and building infrastructure), and the cost-benefit equations in terms of health of the nation, the value of local amenities as a basis for local taxation etc, are hardly affected unless there is a very high value placed on carbon capture. The essential difficulty is the low density population in New Zealand, compared with say the UK or The Netherlands: the embodied carbon in making cycle-ways in New Zealand will take much longer by fewer people to pay off than it does in Europe. Also both London and Amsterdam are dense and flat, and Auckland is spread out and relatively hilly. The UK’s Chartered Institution of Highways and Transportation has published a detailed report on planning for walking (UKCIHT 2015). This has a wealth of real world data, but nothing explicit on infrastructure costs. It does reinforce the point made above that “As towns and cities spread out, people make fewer short journeys [on foot]”. The statistics and details for cycling in the Netherlands (Wikipedia 2017) is also to be compared in term of population density with Auckland, Christchurch (which does have more cycling) and elsewhere in New Zealand. [See more in (3.7) below relating to public transport where similar arguments apply.]
3.6 Purchase the most fuel efficient vehicle for personal needs
The transport sector makes up about 20 percent of New Zealand’s total greenhouse gas emissions each year (http://www.transport.govt.nz/ourwork/climatechange/). Transport also represents over 40 percent of New Zealand’s greenhouse gases from the energy sector. This is a sizeable fraction of emissions to be tackled (NZMOT 2015). The relevant full (and complex) analysis of the current UK transport sector, as a basis for a full discussion of carbon dioxide emissions reduction, is lodged with the Royal Society.
Suppose we take a different view, and mandate that new cars are to be all-electric cars starting from today. The relevant statistic is the rate of entry and departure from the fleet, and the fall in emissions of new entries. If we are to replace the light vehicles at the present rate of about 150K out of 4M, it would take (~4M/0.15M) or 27 years: note this figure is consistent with the average age of the fleet now being 14 years and rising. A Government estimate for fleet turnover is 30 years. In the end, we could in principle save 65% of the vehicular emissions (i.e. all that from the light fleet) or about 10 Mt CO2-eq per year from 2040 onwards. We would need to replace about 4M vehicles if the growth over that 20 years was the same as the last 20 years, much of that associated with the growing population, and a (non-steady) increase in cars per persons, which the data shows is susceptible to economic conditions. We need to compare this CO2-saving measure with the counterfactual of business as usual which shows the continued improvement in the fuel efficiency and reduction of CO2 emissions.
In terms of electric cars, we are starting from the very beginning (MIA 2016): the data on NZ sales of all-electric and plug-in hybrid cars in New Zealand are as follows for the first 10 months of 2016: 46 and 287. This is up from 35 and 227 in the whole of 2015, and 33 and 215 respectively in 2014.
It is hard to get the total cost of new cars purchased in New Zealand, but quoting a Ford Focus (2.0L, 5 door) as typical at NZ$36K, this gives replacement cost (at today’s prices) of order $110B for today’s 3M light fleet. Inflation indexing will take that higher but the decreasing gap between electric and petrol cars will lower it. As of now there are 4 all-electric cars with price tags of $75K, $130K, $180K, $200K as listed on the Ecotricity website (Ecotricity 2017). Even the cheapest is twice the cost of the Ford Focus. Let us suppose we replace the present 3M fleet either with all Ford Focuses as the average car at $36.35K or all Renault Zoe 2016 at $75K: the total extra cost of introducing electric cars (without infrastructure included) comes to $120B. Taking those cars as lasting 25 years – they are unproven in the field above 20 years at present, especially for the battery which would have to be replaced at least 5 times at a further cost (Cleantechnica 2016) (not included hereafter) of order $20K. We would save the 10Mt CO2-eq a year for 25 years, at a cost of $500 per ton of CO2 saved, in terms of the car costs alone, without consideration of the infrastructure. Now the price differential will continue to decline in terms of purchase price, but the cost of petrol cars will be under the same pressure, so we will be dealing with moving targets, and the large infrastructure costs of charging stations of different types cannot be ignored. The infrastructure cost per vehicle will be higher in New Zealand than the USA (Cleancaroptions, 2016) because of the higher population of users there.
The strongest reason for staying with business as usual comes from fuel economy itself. The MBIE data shows a fall of 15% in CO2 emissions per km over the 8 years’ period after 2005. If this rate of fall should continue linearly into the future, and there are the required improvements in the pipeline, we can expect an overall annual increase of just under 2% in fuel efficiency, car for car, or about 2% once note is taken of the compounding of this and the growth of the fleet with newer better cars, all other statistics staying the same. If we assume that the travel per person has been approximately static over the last 12 years, but the population has grown by 0.8% per annum over that period, the personal transport CO2 emissions are falling by 1.2% per 35% of today’s values, which is already well over halfway to that achieved with replaced all vehicles today with the most efficient variant.
There is a half-way house, namely the introduction of a scrappage scheme to take older vehicles with higher CO2 emissions off the road earlier. If we allow like-for-like replacement this will have the net effect of bringing forward the relevant CO2 savings in the pipeline by the number of years early the scrapping takes place. Suppose all 20-year-old cars are scrapped. New Zealand has had scrappage schemes in the past (NZMOT 2009). A key finding of the 2009 scheme report was that “Participants were asked to estimate the value of their cars in order to find out whether the incentive was enough to encourage scrapping as an alternative to selling the vehicle. It could be interpreted that people value the transport utility of their vehicles more than the scrap metal value. The difference in values appears to be a perceived value of about $500 on average, and $1,000 for some, compared to an actual value of about $100 to $200. The higher perceived value suggests that a reward closer to $1,000 would be needed to compensate vehicle owners for what they believe to be the value of their vehicle. There will be an upfront cost to cover the 20% of the fleet over 20 years old (800K cars), and then a steady state level thereafter based on cares reaching their 20 years (typically 150K a year). [Data from the vehicle fleet statistics.] The incentive would be to pay the owners the perceived 20-year-old scrap value to take part, say $1K still. Taking the sudden transition phase, the cost would be $80M, and the CO2 saved would be five years’ worth of difference in emissions between the old and the new car, i.e. from the data above, the emissions per km have approximately halved over that period, so about 10% of all light vehicle emissions or 1 MtCO2-eq/year for five years, for $16 /tonne. This looks a much more attractive way of proceeding. After the first year, the scale of annual extra savings and costs would both go down by a factor of 5-6.
Indeed, the whole issue of electric vehicles and internal combustion engines has been studied in New Zealand (EECA 2015). A parallel set of studies by Concept Consulting is more bullish (Concept Consulting 2016), but my main arguments here are based on the speed of technology development and take-up rather than the long-term economics or emissions savings. In time electric vehicles will have their day, but not soon.
I have neglected to consider heavy trucks where the prospect of electric vehicles is more remote.
3.7 Use public transport, especially trains, where available.
As with walking and cycling, the use and cost of public transport scales for both short and long distances very much with the density of population in towns and cities. This is most graphically shown in data from US cities (Wikipedia: Transport in Portland Oregon 2017): the maximum commuting is in New York where 55% of people commute by public transport, and only 10% commute in Los Angeles, with Washington 35%, San Francisco and Boston 32%. Over 10% of trips each weekday in Sydney (Daniels and Mulley 2011) are made by public transport, with a similar proportion of trips by train (5.2%) and by bus (5.8%), although train trips are longer and account for a higher proportion of total distance travelled.
Wellington is the most compact of New Zealand cities with the greatest level of public transport, but the data (Statistics New Zealand 2015) shows very small changes (at the 1-2% level) in patterns of use between 2001 and 2015 with over 60% commuting by car (including 10% using company cars), 10% by bus, 8% by train, 10% on foot, and 5% as car passengers. In Auckland car transport was the dominant mode of commuting (Statistics New Zealand 2013), although car use has decreased slightly since 2001 – from 85.6 percent of employed people that went to work on census day in 2001 to 82.7 percent in 2013. Public transport is at 5%, walking at 1% and cycling and railway commuting is almost too small to register. At present, the Auckland city and region spends in the order of $1B pa on transport.
As over 30% of New Zealanders and a third of all employees live in Auckland, then we might save 5-6 Mt CO2-eq, if everyone abandons a car and uses public transport. Even in cities much more advanced than Auckland, in terms of public transport, such as Sydney and London, public transport still accounts for a minority of daily journeys. The practical annual savings of a steep increase in public transport will be 1-2 Mt CO2-eq, and with $100/tonne, we have less than $200Mpa to spend on the transition based on emissions savings alone: the cost of Dominion Rd LRT alone including Wynyard Quarter is estimated at $1.4B (or seven years of this saving), and will be accessible by only a small minority of the total Auckland population.
The strong point to be made here is that there may be good reasons to increase public transport, but it is simply not a cost-effective way of reducing carbon dioxide emissions.
3.8 Maximise vehicle fuel efficiency by driver behaviour, car-pooling, vehicle maintenance, correct tyre pressures etc.
Vehicle maintenance and tyre pressures have a very marginal (<5%) on overall CO2 emissions, as does driver behaviour. A very effective car-pooling arrangement could reduce the commuter traffic in New Zealand by of order 50% if every car took a guest passenger. This could be as much as 10% of all car miles driven. There has been a study of carpooling in the USA, where the share of US workers commuting by carpool as declined from 20.4% in 1970 to just 9.7% in 2011, which has salutary lessons for New Zealand (Wikipedia: Carpool 2017), listing problems as flexibility, reliability, riding with strangers, and overall efficiency. The hassle factor in terms of being tied to journey times and companions is very heavy. Child-care arrangements, medical, legal or other professional appointments, dropping off/picking everything from dry-cleaning to lunch, all degrade the take-up and so the CO2 emissions saved. This scheme comes into the realm of personal behaviour and will not change on less than extreme economic grounds, but only by peer pressure, and a societal view that solo driving is deeply antisocial.
3.C Buildings
This is another area where lessons from overseas must be carefully revalued in a New Zealand context.
3.9 Label low-energy appliances to better inform customers
Labelling of itself does not reduce emissions, and cannot be claimed to do so without risking serious double counting, but it may encourage behaviour change the results of which will be captured elsewhere.
3.10 Improve the energy efficiency of new and existing buildings
There is an abundance of useful statistics on the state of New Zealand housing (MBIE 2011). These show that the NZ residential and commercial sector are comparable energy users, and together use about 25% of all NZ primary energy demand at 150PJpa. [In the UK that fraction is 45%.] From the data in section (3.2) above, we already see that only a small fraction of this energy for domestic homes, and likely the same for commercial buildings, is coming from CO2 generating energy sources. Figure 2(b) above indicates that other sectors and fugitive emissions are the places where residential and commercial CO2 emissions are book-kept and these represent a total of 5Mt CO2-eq, i.e. one third of the transport sector.
The key domestic data for NZ (Physics, Otago 2008) shows the relative breakdown of end use is similar to the UK, which I have studied in detail. Domestic appliances represent ~20% of the total emissions of all buildings, i.e. 1 MT CO2-eq annually. The coal and electricity emissions have already been counted above, so that it is only the natural gas/LPG contribution, 10% of domestic emissions, left to count here. The savings here are small and costly, and scarce resources are better focused elsewhere.
I have done a major study of a national retrofitting exercise for UK buildings (Kelly unpublished: The starting point is that £5K spent on a typical house there will have minimal impact, while £50K will allow significant energy-saving measures to be undertaken: everything scales from that fact), and the cost to retrofit the UK building stock to halve the energy use therein, and reduce the UK carbon emissions by 23% in consequence, was of order £1.7T with a payback period, based on reduced energy bills, of 50 years at present prices, and an embodied carbon added to the stock or order of 30 years’ new build. Neither is an attractive prospect, and the economics simply do not add up. If the New Zealand data is comparable, and that needs further study (BRANZ 2014), then retrofitting will not happen under any business-as-usual case as it makes no sense until CO2 is valued a great many times more than now. The business case for retrofitting is made on the other grounds, such as health, or energy use efficiency, but the CO2 emissions reductions must always be regarded as collateral benefits, and not a primary justification. Commercial buildings are much more heterogeneous, and fewer but bigger – hotels, hospitals, warehouses, office blocks, retail outlets, schools, etc. and do contribute 40% of all the energy use in building excluding industrial processes.
3.11 Remove the most energy inefficient appliances from the market
From (3.9) above, we see that the total domestic appliance market accounts for only 1% of New Zealand CO2 emissions, and replacing the average with the best will save only 20-30% of that. The upgrading of appliances in the commercial sector occurs more frequently than in the domestic sector, so the saving is commensurately lower. [The figures for the UK indicate significant makeovers in homes once every 20 years, in offices etc. once every 7 years.]
3.12 Provide standards and training for the design, installation and use of lower energy buildings and equipment.
Educating and training of itself does not reduce emissions, but may encourage behaviour change, the results of which will be captured elsewhere.
3.D Industry
We begin this section by noting that industrial processes and product use represents only 6% of New Zealand’s gross emissions. This already means that actions to reduce CO2 emissions taken on a no-regrets basis (i.e. actions that are fully justified for other reasons) should be undertaken and the emissions reductions noted as a collateral benefit.
3.13 Greater focus on energy efficiency in industrial processes
Energy efficiency has always been crucial for attaining competitive advantage in manufacturing and industrial processes more generally and especially so in the energy intensive industries. The balance is made between the total costs of change of ownership from older to newer equipment versus the increase in profitability that can be captured. The only difference between now and earlier parts of the industrial revolution is the complexity of products, and the extent which IT is used to improve productivity. Within that business-as-usual advance, the arrival of 3D printing, initially of small artefacts but now of multi-metre scale artefacts is reducing the materials needed which reduces (i) costs, (ii) the energy used, and (iii) the waste generated, and (iv) in consequence of all three, the level of CO2 emissions.
It is not clear where the investment of New Zealand dollars should be made to increase the focus on energy efficiency over and above what is daily good industrial practice. No further CO2 savings can be foreseen over and above the trend reductions already being seen in the industry.
3.14 Increase of renewable heat (solar thermal, geothermal, bioenergy)
In (2.2) above, we showed the small amounts of heat generated using fossil fuels, and therefore the even smaller amount of CO2 to be saved in industrial processes. On-site combined heat and power stations only make sense when the fuel supply and energy demand are co-located as at Kinleith.
3.15 Invest in on-site generation of renewable energy
The economics of on-site generation of renewable energy is very questionable in any areas that are connected to the New Zealand grid, where the economies of scale in producing renewable energy is already better captured. Even in remote communities, it is small-scale renewables, and therefore small-scale CO2 reductions, that make any sense at all. I am assuming that less than 1% of the population lives/works off-grid in their main residence/occupation, (excluding farmers in the field) and that fewer industries operate off grid. This suggests that the CO2 savings from specific further actions under the RSNZ report are negligible. Those who are off-grid have usually made life-choice decision that mean that they are very low CO2 emitters already, even with elevated costs.
3.E Agriculture
In contrast with industry above, agriculture here and forestry next represent the real opportunities for significant reductions of New Zealand greenhouse gas emissions. Again the international scale is important (Wikipedia: GDP by Country 2017): in 2001, the New Zealand GDP was made up of 4.8% agriculture, 24.5% industry, 70.7% services, while the world in 2016 was 5.9% agriculture, 30.5% industry and 63.6% services. This shows that the NZ economy of heavier in services and lighter in both industry and agriculture than the world average. The world GDP was US$74T and the New Zealand GDP was US$174B, making New Zealand’s share of world agricultural GDP to be 0.3 percent.
3.16 Increase and accelerate development and adoption of best practices that increase the productivity of animals and efficiency of farm systems.
This represents business as usual as far as a steadily increasing development is concerned, but any acceleration will reduce CO2 emissions over and beyond the current trajectory. How much greater scope is there for acceleration? Agresearch’s 2014-19 Statement of Corporate Intent describes itself as the leading CRI in the area of ‘Agriculture-derived greenhouse gas mitigation and pastoral climate change adaptation’ (Agresearch 2014). The Ministry for Primary Industries has the target of doubling primary sector exports by 2025. This target is aligned with the Government’s Business Growth Agenda, which seeks an increase in exports from 30% to 40% of GDP by 2025. [Note that the global data (Wikipedia: GDP by country 2017) shows agriculture at 5.9% of world GDP in 2016 at US$4.4T.] On a global scale, the growth in world demand for agricultural products is expected to fall from an average 2.2 percent a year over the past 30 years to 1.5 percent a year for the next 30. In developing countries, the slowdown will be more dramatic, from 3.7 percent to 2 percent, partly as a result of China having passed the phase of rapid growth in its demand for food (FAO 2017). Of the 18 high-level impacts that Agresearch is aiming to deliver on, impact 15 “Reduced environmental footprint of pastoral farming operations” is directly relevant here in the reduction of greenhouse gas emissions being only one among other important areas such as improved riparian management and less invasive pest control systems, along with Impact 16 “Practical policy solutions developed and adopted” making sure that new knowledge and practices are adopted once developed.
It is not possible to extract numerical data on the total capacity for such emissions reductions from the targets set, namely a 1.5% reduction (supposed annually) from an increase in GHG intensity, in addition to a 1% reduction achieved though on-going efficiency gains. Given that agriculture is already the leading exporter and the government targets an ambitious doubling of exports by 2025, (i.e. over 2015-2024, so a 7% compound annual growth rate), so even with the 2.5% reduction above this still implies a 5.5% growth of GHG emissions per year or a 70% increase over the coming decade. If we were to halve GHG emissions from agriculture over the next decade, we would need a 14% compound annual reduction in GHG emissions over the next decade, not 2.5%. This is indeed the crunch point of this whole analysis. The Government’s growth target for agricultural exports is at variance with its emissions targets – in most other developed countries it is the industrial and climate policies that are in direct conflict.
Since half the global warming potential of NZ GHG emissions come from this sector, a 70% increase over the next decade makes clear just how important it is that scarce New Zealand resources are concentrated where the impact is likely to be the greatest.
A major international study (Smith et al 2008) shows that agricultural lands occupy 37% of the earth’s land surface. Agriculture accounts for 52% and 84% of global anthropogenic methane and nitrous oxide emissions. Agricultural soils may also act as a sink or source for CO2, but the net flux is small. Many agricultural practices can potentially mitigate greenhouse gas (GHG) emissions, the most prominent of which are improved cropland and grazing land management and restoration of degraded lands and cultivated organic soils. Lower, but still significant mitigation potential is provided by water and rice management, set-aside, land use change and agroforestry, livestock management and manure management. The global technical mitigation potential from agriculture (excluding fossil fuel offsets from biomass) by 2030, considering all gases, is estimated to be approximately 5500–6000 Mt CO2-eq. /yr , with economic potentials of approximately 1500–1600, 2500–2700 and 4000–4300 Mt CO2-eq. /yr at carbon prices of up to 20, up to 50 and up to 100 US$ per t CO2-eq. , respectively. In addition, GHG emissions could be reduced by substitution of fossil fuels for energy production by agricultural feedstocks (e.g. crop residues, dung and dedicated energy crops). The economic mitigation potential of biomass energy from agriculture is estimated to be 640, 2240 and 16 000 Mt CO2-eq./yr at 0–20, 0–50 and 0–100 US$ per t CO2-eq., respectively. As with the analysis given above in (3.2) for private motoring, the value of captured carbon dioxide sets the fraction capturable from 25% to 66% for moderate to high values. One notable feature of this work is that the restoration of degraded farm lands is the practice that has the quickest and largest wins.
From a recent study (Wollenberg et al 2016) “More than 100 countries pledged to reduce agricultural greenhouse gas (GHG) emissions in the 2015 Paris Agreement of the United Nations Framework Convention on Climate Change. Yet technical information about how much mitigation is needed in the sector versus how much is feasible remains poor. They identify a preliminary global target for reducing emissions from agriculture of ~1 GtCO2e yr−1 by 2030 to limit warming in 2100 to 2 °C above pre-industrial levels. Yet plausible agricultural development pathways with mitigation co-benefits deliver only 21–40% of needed mitigation. The target indicates that more transformative technical and policy options will be needed, such as methane inhibitors and finance for new practices. A more comprehensive target for the 2 °C limit should be developed to include soil carbon and agriculture-related mitigation options. Excluding agricultural emissions from mitigation targets and plans will increase the cost of mitigation in other sectors or reduce the feasibility of meeting the 2 °C limit.” Note that New Zealand total emissions are 0.08GtCO2eq/year and half that is from land use: the pressure on other sectors of the New Zealand economy will be proportionately higher if agriculture does not play its part.
The work in this section is designed to lower the rate of growth of greenhouse gas emissions from agriculture. A cost-benefit analysis for the sector as a whole is hard for these farming systems as many different actions could be undertaken: the analysis should be attempted.
3.17 Selectively breed cattle and sheep that emit relatively low volumes of methane and modify rumen biology to reduce emissions.
The release of methane gas from ruminant livestock (sheep and cattle) amounts to ~30% of New Zealand’s greenhouse gas emissions (Landcare Research 2017), and it is the largest single contributor. Methane also accounts for over 40% of all emissions in terms of global warming potential. However, internationally the dominant sources of methane are rice paddies and wetlands, not farm animals. New Zealand therefore has a special interest in the measurement and mitigation of methane emissions from livestock. The inventory of NZ’s greenhouse gas emissions is calculated annually by the Ministry for the Environment and reported internationally. According to this inventory, methane emissions from ruminants have increased by 10 % since 1990. (Over the same period, carbon dioxide emissions from road transport have grown by 62 %, and nitrous oxide emissions from agricultural soils by 25 %.)
Work is in progress on this front in terms of feedstuffs: AgResearch scientists have identified five different animal-safe compounds that can reduce methane emissions from sheep and cattle by 30 to 90%. Results from animal trials were presented at the 2015 New Zealand Agricultural Greenhouse Gas Mitigation Conference (Agresearch 2015). Genetic selection for residual feed intake is an indirect approach for reducing enteric methane (CH4) emissions in beef and dairy cattle, and 14% reductions are to hand from US studies of beef (J A Basarab et al 2013). The problem of a common food additive that reduced methane emissions from cows, namely foreign grown palm kernel expeller, is that it makes unsustainable demands on palm oil forests (News bulletin 2017).
Given the scale, the cost savings per tonne of CO2 saved is still high. Every three percent drop in animal emissions of methane represent a 1% fall in the New Zealand emissions. Placing the value today of capturing CO2 of about $60-90/tonne, a 2.5% annual fall in emissions (Agresearch’s professed target) would equate to about $120-180M in value which is only about a third of what is spent already on palm kernels expellers (Green Party 2015). This industry would need to value CO2 at three times the prevailing level have this action break even at present.
This again raises the question of whether investments to reduce CO2 are better made overseas rather than at home to maximise the New Zealand contribution to the actual global problem.
3.18 Explore the potential for developing alternative land-uses with lower greenhouse gas emissions.
Exploring the potential and developing alternative land-uses do not of themselves lower greenhouse gas emissions. In section (3.19) below, we see a return of marginal land to forest makes economic sense. The process is already underway in the business as usual context, but if the rate of return were to double, the NZ capacity could be exhausted by 2050. Just as (3.16) expresses the real problem, the answer is in front of us here and in the next section. It is important that these particular numbers are rechecked by finding further data sources.
3.F Forest and Land Use
3.19 Convert more marginal land area to forest stands.
As of 2012, 31.5% (82700km2) of NZ was covered in forest, up from 29.2% in 1992 (Trading Economics 2017). Nearly twice (58%) that area is used in agriculture.
How much scope is there for further afforestation? At the outside it could double, by impinging on all but the most productive agricultural land. Forests sequestered 27 Mt Co2-eq in 2013, so that figure could double to 54 Mt Co2-eq, and reduce the net emissions to 29 Mt Co2-eq according to the data in section (2.1) above. How much would this cost? The lowest estimate (NZFFA 2017), using retired pasture, is of order $1300/ha: others vary up to $2000 under the same circumstances. If all the land were like that the minimum cost is $10B. This equates to about $370 per tonne of CO2 saved, but this is offset by revenues as discussed below. It is not clear how rapidly the cost grows for back-country hill farms. The important aspect of forestry is that every thirty years the forest can be harvested, and subsequently replanted, and present exports could be doubled from over $5B to more than $12B under the above scenario, offsetting the initial outlay. Note that permanent forestry does not permit this revenue, and is unlikely to attract landowners, unless paid handsomely to maintain the forest in the way the EU farmers get subsidies to maintain the countryside: this latter is deeply unpopular in urban EU and NZ. We do not yet know the long-term effect on soil quality of permanently productive forestry but this could be a major inhibitory factor. Notice how different is the economics of this move in New Zealand compared with changing the ground transportation system.
There are further considerations where direct comparisons of land use are made, and the internal rate of return for different uses is a directly comparable measure (Evison 2008). This shows that land used for dairying, viticulture and arable gave two or three times the percentage return on investment for commercial units compared with sheep and beef grazing, deer and forestry, which would be suitable for conversion. That suggests that the case against more forestry on economic grounds is not strong if the land is taken from grazing land not dairy. This data is a decade old, but the ratio represented by the internal rate of return is not likely to change changed greatly in the intervening time, although this needs checking.
The New Zealand land-use data in 2008, and changes over the period 1990-2008 are available (MFE 2010), and show that low-producing grassland is of equal area to that of native forest. The data on land use change shows that afforestation is occurring but at a rate that about half that needed to achieve a doubling of cultivated forest by 2050. The initial findings on the merits of harvestable forestry are reinforced by this analysis. Non-harvesting forest makes no economic sense other than under a heading of philanthropy.
The global picture is as follows: from the FAO’s review (FAO 2016) of global forestry for 1990-2015 we read: “The bulk of the world’s forests is natural forest, with reported natural forest area amounting to 93 percent of global forest area, or 3.7 billion ha, in 2015. From 2010 to 2015, reported natural forest area decreased by a net 6.5 million ha per year. This is a reduction in net annual natural forest loss from 10.6 million ha per year for the period 1990 to 2000.” Given that 1 hectare is 0.01 km2, we see that total reforestation of New Zealand as per above would represent a change of 0.1% globally. We must not exaggerate the absolute impact of our actions.
3.20 Produce and use low-carbon wood materials for building construction
This is common practice, and the real question is what greater capacity is there for this action in New Zealand, or in the export of wood-materials for overseas buildings? Note however that the implied CO2 saving here are book-kept with the planting. Also using wood and bio-mass for electricity production, and burning clippings from the forestry, release CO2 and constitute a fractional negative savings which also need to be book-kept here. Data from 2010 show how the NZ wood processing is made up (NZ Wood, 2013), showing the significant added value of processing logs in New Zealand is clearly evident. “New Zealand’s Wood Processing and Manufacturing sector purchases 60% of the current annual log harvest and adds $4 billion per year of value to those logs. From a total income of $5.3 billion, it currently generates $2.8 billion in export receipts and directly employs 11,000 New Zealanders.”
The trend data is also encouraging. The data (NZFOA 2014) since 1987 shows that domestic use of wood has increased from 9M m3 to 13M m3 (peaking in 2002) and back to 12M m3 in 2014, while the export of logs has increased from less than 1M m3 to 17M m3 over the same period. The export market is where the rapid growth is and is likely to continue in the present global economic climate. Within the scale of the current forestry, it seems that there is a logging capacity to increase processed exports by about 50% and therefore bring the income in 2010 terms up to $8B. This is a measure which is worth studying further.
3.21 Use more woody biomass residues for bioenergy applications
Under (3.2) above, we have analysed the scope for bioenergy applications in the New Zealand context and have found a very limited scope for significant CO2 reductions, in a grand scheme of things other than in replicating where possible the Kinleith example where residues are cheap to collect and the heat and energy demand is local.
3.22 Discourage landowners for converting forest stands to other land uses.
If this statement means to replace farmland with forest in terms of land use, it makes eminent sense. If it means that once land its forested, it should be left untouched, that deprives a private land owner of future income. The only basis for that action is in philanthropy or government buy-back. There may be more opportunities of that in longer term, if aeroponic factories (Philly.com 2015) and factory grown meat (Gismodo.com 2016) become the norm in 40 years, and the demand for current farm produce may fall if megacities become self-sufficient in animal and vegetable protein from within city boundaries (Kelly 2016). That is something for long-term planning, not a matter for mitigating CO2 now. In terms of evolving toward a more vegetable protein diet, data from an FAO study (Clonan et al, 2016) shows an ever increasing intake of animal protein everywhere in the world until 2050, unless some force majeure intervenes.
3.23 Further encourage regeneration of native forests and permanent forest sinks.
This is a statement for governments, and it makes sense on a scale that would double total forestry area by 2050, especially in the longer (40-year) term if the technology for off-farm production of animal and vegetable protein as referred to above is developed and deployed.
3.G Actions by Individuals, by Business and by Local and Central Government
The actions here represent an orthogonal cut through the same set of issues, but now focussing of who should do what. The only issue worth of further comment is the exhortation to fly less often and far. Air travel in terms of emissions per passenger kilometre travelled is very efficient and competitive with other modes of transport, especially when an hourly rate is put on the elapsed time of business travellers. Much of advanced learning in science and technology is international now, and to preclude access to this by restrictions on travel probably is to endanger the future of the New Zealand economy. It is true that most mass conferences could now be replaced by electronic communication systems, at modest cost, and the COP series of the climate change community would be an ideal exemplar in this direction. One third of all energy used in the UK is consumed by private and public transport, the level of which is a defining feature of modern civilization. There is real scope for virtual tourism – for example capturing all the effects and images associated with a train journey from say Christchurch to Greymouth, and reproducing this in Olympia in London (© M Kelly 2013) – it might save costs of fewer UK patrons coming to New Zealand, but it may have exactly the reverse impact attracting many to come for the real experience. If air travel were to be severely curtailed for any reason (pandemics, volcanism, financial chaos or warfare), much of the global economy associated with advanced logistics would collapse, as would tourism. Here is the case for a public debate on where rightful consumption ends and profligate consumption begins. See more in section 5 below.
General improvement in personal attitudes and changes in personal behaviour can have a significant effect on CO2 emissions if only in the context of significant reductions (e.g. halving) in the demand for energy for mobility, communications and information, warmth, safety etc. that characterise a modern developed society. The subset of all these actions that is technology based in terms of CO2 emissions savings are small.
Forty percent of the New Zealand Economy is in the Public Sector, but this is mainly in the provision of services that use the manufactures and energy provided by the private sector. It can use taxpayers’ money to incentivise change that results in reducing carbon emissions, but that has to be done in a much wider context, as that same money, once committed to CO2 reductions, cannot be reused to adapt to climate change, prepare for future earthquakes or improve the resilience of communications to space storms, or cybercrime or warfare.
4. Scarce Resources
I start by noting that climate change is a progressively evolving risk whose level and progression rate is highly uncertain. Under these circumstances the best use of scarce resources needs to consider optimum investments over time to manage those risks, and this includes real options. In addition, in the real world, market sentiment represents a risk.
How much can/should New Zealand afford to invest in mitigating climate change, and where and on what should it be invested? Climate change is just one of a number of major threats to New Zealand that include natural disasters such as earthquakes, volcanos and tsunamis, but also extend to other threats, such as solar electromagnetic storms that could wipe out GPS (and all the ground based services it supports) and all space-based communications, or man-made problems, such as a collapse of the international financial systems, or cybercrime or cyber-warfare, or a major pestilence or human or animal pandemic. Money spent on these contingencies is money not spent on productive things in the here and now. The quandary has been best summarised by Alan Greenspan (2013) as “The choice of funding buffers is one of the most important decisions that societies must make, whether by conscious policy or by default. If policy makers, private and public, choose to buffer their population against every conceivable risk, the nation’s current standards of living would, of necessity, decline. Funding such “investments” requires an increase in savings and, accordingly, a decline in immediate consumption. Resources can be put to active use or on contingency standby status, but not both at the same time. Buffers are a dormant investment that may lie idle and seemingly unproductive for much of their lives. But they are included in our total real fixed assets (and real net worth) statistics. It is no accident that earthquake protection of the extent employed in Japan, for example, has not been chosen by less prosperous countries under similar risk of a serious earthquake. These countries have either explicitly or implicitly chosen not to divert current consumption to fund such an eventuality. Haiti, a very poor country, has not yet fully recovered from its 2010 earthquake. It has neither built a protective infrastructure like Japan’s nor has it had resources to recover on its own. Buffers are largely a luxury of rich nations. Only rich nations have the resources to protect their populations against events with extremely low possibilities of occurrence.” Note: for Japan and Haiti he could have written New Zealand and the Pacific Islands.
There is only one national contingency fund, and I suspect, without empirical proof, that earthquake strengthening of buildings and infrastructure and biosecurity measures would both have far greater public support rather than carbon dioxide reductions over and above what is achieved on the basis of business as usual.
Another way of looking at this is to consider the capacity for further debt being taken on by the New Zealand Government or by New Zealand citizens for the specific aim of reducing CO2 emissions. The current Government debt (of $62B) (Tradingeconomics.com, 2017) as a ratio of GDP is 24.6%, and in the past is has been as low as 4% and as high as 58% (this last immediately after World War Two).
Faced with such uncertainty on what can be afforded without endangering what we have now as economic prosperity (for which there would be no popular mandate), the best one can do here is to identify what would represent the best way of spending $1Bpa, $3Bpa, or $10Bpa, on CO2 mitigation and leave it to Parliament to decide on our behalf where to draw the line. There is no practical question of going above $10Bpa. Given that the cost of earthquake recovery for Christchurch is estimated at $40B of which $15B falls to the Government, the annual spent of $10B is clearly an upper limit of an insurance premium for future climate change at the present time.
If the aim is to get the greatest reduction in global emissions of CO2 by such a spend, it is not clear that all, or indeed any, of this money should be spent in New Zealand. The largest growth in emissions will be in China, India and Africa in the next decade. A recent IMF paper (IMF 2016) suggests that carbon tax or a coal tax is the most effective short-term measure to mitigate CO2 emissions in China. They suggest a modest carbon tax of RMB 15 per ton in 2017 of carbon rising to RMB 227.5 in 2030. Given the current usage of 3B tonnes of coal, this tax raises of order $8Bpa alone. It is clear that any contribution to China from New Zealand cannot be considered significant. The use of this money in Africa gets entangled with international development and aid programmes.
Suppose we constrain the spend to be in New Zealand, and direct that its primary function is to reduce CO2 emissions. The four places where investment would lead to greater reductions of CO2 emissions based on what we know today are (in order): (i) reforestation of low grade agricultural land, (ii) increasing the local use and export of processed timber as a building construction material, the move towards (iii) lower emissions from ruminants and (iv) 100% renewable electricity. If the money were to be spent on R&D to have greater impact a decade from now, then breeding lower-methane-producing ruminants and developing lower methane feedstuffs would the most effective, and strategically the most important in getting an eventual reduction in GHG emissions from agriculture. As a starting point three equal annual investments over the first five years of $1Bpa should not attract criticism, as the areas all have a positive return on investment, with collateral CO2 emissions savings. But how many tonnes of CO2 equivalent in the short-term? (A NZ firm http://www.groupone.co.nz/intro/pastoral-robotics-ltd/ has developed a system for reducing nitrate leaching into waterways and N2O into the atmosphere.)
The economics of tree planting has been summarised recently as follows (Stuff.co.nz 2013): “New Zealand Farm Forestry Association president Ian Jackson said planting and maintaining a forest did not cost much, but it took about 30 years for pine trees to mature. In that time, storms and fire could destroy the trees, and the price for logs could vary. Wind insurance was not available, Jackson said, but if everything went well, investing in trees gave the highest return for marginal land unsuitable for grazing. The market for logs has been very good in the last two years,” he said. Planting a hectare of forest cost about $1500. It then cost about $4000 per ha to maintain the trees for the first eight years. After that, the investors could usually sit back and wait 22 more years until harvest, Jackson said. The current net return was between $25,000 and $40,000 a hectare, Jackson said.” On this basis $1Bpa for 15 years would enable all 7.5M hectares of low-grade farmland to be reforested. After 30 years the return would be of order $37-60B. The carbon sequestered on poor farmland will be of order 5-8t CO2eq/hectare per year itself, or a total of order 1500MtCo2-eq or nearly seventeen times the current total emissions from New Zealand. This reinforces the comments Ian Jackson above and the points made in (19) above. The positive returns here (less the losses due to storms, fire or disease) should be attractive to private investors.
Note that New Zealand does have a Government tree-planting scheme but it is on a very small scale (MPI 2017): The Afforestation Grant Scheme (AGS) is a funding programme designed to help establish 15,000 hectares of new forest between 2015 and 2020. It was in response to the observation that the growing of new forests has declined over the past 2 decades – from 55,000 hectares planted on average each year in the 1990s to just 3,000 hectares in 2014. Compared with these investment, the increase processed wood product is rather smaller, but still economically positive.
5. Behaviour Change
One area touched upon but not developed in the Royal Society Report is personal behaviour change, which has major opportunities to reduce CO2 emissions. Societal change has happened in recent decades on issues such as smoking in public confined places and on drink-driving. If we could get to a stage where the profligate consumption of resources, including especially energy, was regarded as deeply antisocial, there is some hope. Without that view taking hold, I submit that there is no chance of achieving deep cuts in CO2 emissions. It is incumbent on those who are the loudest in calling for technology options to take the lead in their personal behaviour patterns to start getting this change underway under the maxim ‘do-as-I-do not do-as-I-say’.
A study has been made to show how personal behaviour change could have a much greater impact in the near term in reducing carbon emissions than the misplaced faith in energy technology providing the get-out-of-jail card (Baziel et al 2013): they estimate that a more frugal existence in the UK could be had on half the energy per person per day, while not seriously degrading the overall standard of living: international flights but rather fewer of them, much smaller and lighter-weight cars taking longer to accelerate to 100km/h, food sourced more locally with fewer unseasonal imports, etc. A public campaign against more profligate use of resources including all forms of energy, would make inroads into our carbon emissions, but at the clearly acknowledged consequence of reduced economic activity. If emissions reduction is the first and only criterion for action this campaign is simply essential. It is a matter for the democratic opinion whether it is feasible.
It is an important fact to note that air travel generates 2% of all CO2 emissions (ATAG 2017), and that level of emissions is equalled now by the use of the internet, and particularly the search engines, and the rapidly growing area of internet communications (Climatecare 2017). The growth rate of the internet use is much greater than aviation and the latter will become a serious issue if unchecked.
A serious look at the scope for behaviour change to help in CO2 emission reduction is called for.
6. Is New Zealand’s carbon dioxide mitigation really necessary?
So far we have assumed that mitigation of carbon dioxide is a good thing, and essential to ward off future climatic disasters, even though this last cannot be proven. Here we balance the picture by firstly looking at the neutral aspects and the upsides of higher concentrations of carbon dioxide in the atmosphere. Are there other factors affecting Climate Change that may make carbon dioxide mitigation less critical?
Most research has focussed on the possible long-term downsides of more CO2 in the atmosphere, but there are real-world upsides of increased atmospheric CO2 in the here and now. Satellite data shows a distinct greening of the earth over the past few decades, of the order of 10% in some key places such as India, Western Australia and the Sahel in Africa (Donohue et al 2013), where massive famines of 20 years ago are not being repeated because of increased production assisted by the increased CO2. There is a rich literature on the benefits of enhanced atmospheric CO2 on vegetation (Cure et al 1986, Hollingsworth 2915, Kimball et al 1993). This applies to New Zealand with somewhere between 20% and 40% crop growth rates even after land fertilizer considerations are factored in, if the atmospheric CO2 concentration were to double.
It is important to remember that of all terrestrial CO2, 93% is in the oceans (Waterencyclopedia 2008) 2017), 5% in the earth (greenery and surface rocks) and only 2% (or 850B tonnes) is in the atmosphere (Wikipedia Carbon Cycle 2017). Human activity is still small compared with nature in the annual interchange between these reservoirs.
If the average temperature goes up for any reason, then the seas will warm and more CO2 will come out as gases are less soluble in warmer water while the general humidity will rise. More evaporation means more clouds and an increase in the ‘umbrella-shading effect’ causing some planet cooling. With more clouds, more rain, more dust scrubbing and some atmospheric CO2 scrubbing (weak carbonic acid forms), there is some self-healing, self-compensating, self-restorative, self-buffering effects. The chances of a CO2 induced atmospheric thermal runaway can be discounted, as the more extreme atmospheric conditions of the past failed to induce such a runaway. The present hiatus in temperature rise since 1998 while CO2 emissions have gone on increasing is prima facie evidence of some such moderating feedback – the longer the hiatus continues post the El-Nino event of the last two years, the more urgent the real understanding of this effect on future climates will become (APS 2014).
Sea level rise is posited as the main future concern, and one or two metres rise in a century or two may eventuate. The correct response here is comparable with that taken in the UK with the building of the Thames barrier in the 1980s when actuarial calculations showed that the costs of the barrier would be small compared with the costs of floods in the first decades of the barrier, as indeed has been the case. The major problem over recent decades has been the build in low-lying areas in NZ and elsewhere, and the renaming of what used to be called sea erosion as sea level rise and climate change.
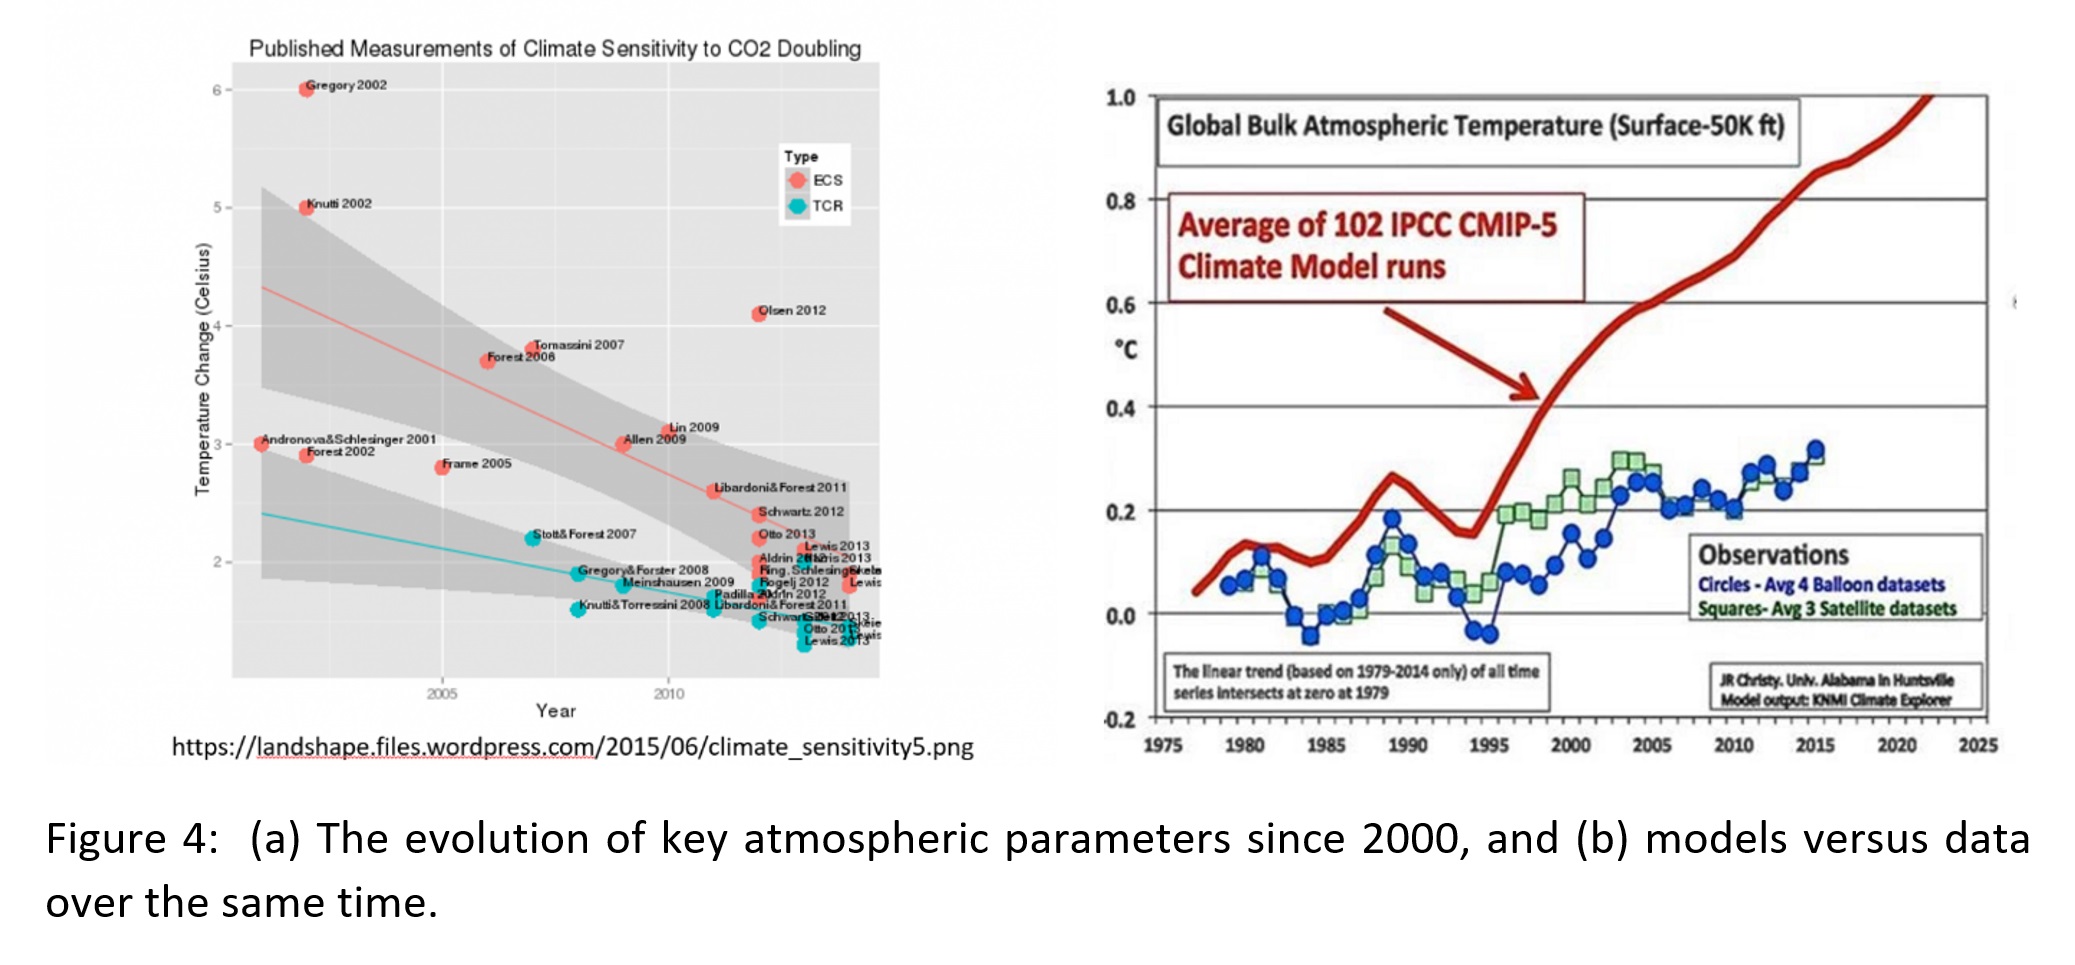
Climate model calculations of future climates are at the heart of the urge to mitigate CO2 emissions, but there remains a problem at the heart of the models. From the complex, multi-component, tightly coupled, highly nonlinear system, the leading parameters to be extracted are the change in mean atmospheric temperature on a 30-year (transient climate response) and a long term (equilibrium climate sensitivity) basis in response to a sudden doubling of the concentration of CO2 in the atmosphere. These two numbers have been studied empirically and theoretically over two decades, and the result has been a steady downward shift from means of over 4C and 2C to 2.5 and 1.5C now (see Figure 4a) (Lewis and Curry 2015): this is clear evidence that the earlier model results have overestimated the level of global warming (see Figure 4b) (Christy 2015, given under oath as part of a US congressional enquiry on the matter), but we have not yet had an appropriate lengthening of the timescales of future catastrophe which might follow.
In terms of value for money of investments to avert future climate change the following quote is not to be forgotten (CFACT 2016): As University of London (climate scientist) Professor Emeritus Philip Stott has noted: “The fundamental point has always been this. Climate change is governed by hundreds of factors, or variables, and the very idea that we can manage climate change predictably by understanding and manipulating at the margins one politically selected factor (CO2) is as misguided as it gets.” “It’s scientific nonsense,” Stott added. There are several websites collecting peer-reviewed literature that question aspects of the climate science consensus, particularly around future catastrophes. (Popular Technology 2017)
7. Overall conclusions
On the basis that reducing New Zealand’s CO2/greenhouse gas emissions is still the target, the following conclusions apply:
- The case for afforestation and reforestation, at a rate double that at present, is so compelling compared with all other investments over the next decade, that this should be the main focus of further studies.
- The second focus should be the support of R&D to reduce methane emissions from ruminants.
- Increasing the export of processed timber for buildings offers positive returns, but the savings of CO2 emissions will be captured within forestry per se.
- A serious national programme to change attitudes on profligate consumption of any resources should be launched.
To the extent that changing the future climate is the aim, the impacts will be negligibly and unmeasurably small. Is a futile gesture necessary?
Acknowledgements: I wish to thank Ralph Sims FRSNZ, Roger Ridley, Andrew Cleland, Simon Arnold Bryan Leyland and Jock Allison for their critiques on an earlier draft of this paper. I am grateful to Geoff Duffy FRSNZ for details on atmospheric CO2.
REFERENCES
Agresearch, 2014. https://www.parliament.nz/resource/en-NZ/50DBHOH_PAP56674_1/38eebb75ba02bc8350b41de55463adf44683ef5f
Agresearch, 2015. http://www.agresearch.co.nz/news/shortlist-of-five-holds-key-to-reduced-methane-emissions-from-livestock/
APS, 2014. http://www.aps.org/policy/statements/upload/climate-seminar-transcript.pdf
ATAG, 2016, http://www.atag.org/facts-and-figures.html
Basarab JA et al, 2013. Reducing GHG emissions through genetic improvement for feed efficiency: effects on economically important traits and enteric methane production. Animal Jun; 7 (Suppl 2): 303–315. doi: 10.1017/S1751731113000888, PMCID: PMC3691002
Bajzel B et al, 2013. Designing climate change mitigation plans that add up. Environ. Sci. Technol. 47, 8062-9
BRANZ 2014 http://www.branz.co.nz/cms_show_download.php?id=182d3ae296d4d92be905477582ae2453c0671d58
CFACT, 2016. https://www.cfact.org/wp-content/uploads/2016/11/2016-State-of-the-Climate-Report.pdf
Christy J, 2015. Congressional testimony from Dr John Christy https://judithcurry.com/2015/12/17/climate-models-versus-climate-reality
Cleancaroptions, 2016. http://cleancaroptions.com/html/ev_fuel_infrastructure_cost.html and there is more data, not used here from https://cleantechnica.com/2014/05/03/ev-charging-station-infrastructure-costs/ and http://www.forbes.com/sites/davidkiley5/2016/02/29/report-cost-of-electric-vehicles-falling-fast-will-drive-demand/2/#66c175555770, http://www.forbes.com/sites/davidkiley5/2016/02/29/report-cost-of-electric-vehicles-falling-fast-will-drive-demand/2/#66c175555770
Cleantechnica, 2016. https://cleantechnica.com/2016/05/15/ev-battery-prices-looking-back-years-forward-yet/. See also http://www.mycoolelectriccar.com/electric-car-batteries.html from which “The main issue with electric car batteries, is their cost. They cost about $2000 to replace because you are working entirely off battery power. EV batteries wear out faster than a ‘regular’ car battery because they are the only source of power in the vehicle. Usually, they last about four years. Your battery could last longer if you do less than about 50 miles a day in your car. If so, the cost of replacement may not be a big issue for you.”
Climatecare, 2017. https://climatecare.org/infographic-the-carbon-footprint-of-the-internet/
Climate Change Committee UK, 2017. https://www.theccc.org.uk/charts-data/ukemissions-by-sector
Clonan A et al, 2016. Socioeconomic and demographic drivers of red and processed meat consumption: implications for health and environmental sustainability. Proc Nutr Soc. 75(3): 367–373.
Concept Consulting, 2016. http://www.concept.co.nz/uploads/2/5/5/4/25542442/_new_technologies_emissions_report_final.pdf and http://www.concept.co.nz/uploads/2/5/5/4/25542442/new_technologies_economic_report_v2.0.pdf
Cure JD, 1986. Crop responses to carbon dioxide doubling: a literature survey. Agricultural and Forest Meteorology, 38, 1986, 127-145 http://www.sciencedirect.com/science/article/pii/0168192386900547,
Daniels R and Mulley C, 2011. http://sydney.edu.au/business/__data/assets/pdf_file/0013/106501/Daniels-Mulley-Explaining.pdf
Donohue RJ et al, 2013. Impact of CO2 fertilization on maximum foliage cover across the globe’s warm, arid environments. Geophys. Res. Lett. 40, 3031–5, doi:10.1002/grl.50563
EECA, 2015. https://www.eeca.govt.nz/assets/Resources-EECA/ev-lca-exec-summary-nov-2015.pdf
EECA, 2017. https://www.eeca.govt.nz/energy-use-in-new-zealand/energy-impacts/
Evison D, 2008. ‘A method for comparing investment returns from major rural land uses including forestry’, NZ Journal of Forestry 53 (3) 27-32
FAO, 2015. http://www.fao.org/3/a-i4793e.pdf
FAO, 2017. http://www.fao.org/docrep/004/Y3557E/y3557e03.htm#c
Gismodo.com, 2016. http://gizmodo.com/the-future-will-be-full-of-lab-grown-meat-1720874704
Green Party, 2015. https://blog.greens.org.nz/2015/10/08/fonterra-is-waking-up-to-the-risks-of-unsustainable-dairy-feed/
Greenspan A, 2013, 2014. The Map and the Territory 2.0: Risk, Human Nature and the Future of Forecasting. Penguin
Hollingsworth B, 2015. Record CO2 Coincides With Record-Breaking Crop Yields, ‘Greening of Globe. http://www.cnsnews.com/news/article/barbara-hollingsworth/record-co2-coincides-record-breaking-crop-yields-greening-globe
IMF, 2016. https://www.imf.org/external/pubs/ft/wp/2016/wp16148.pdf
Indian report, 2016. http://www.power-technology.com/features/featurehas-an-anglo-indian-project-finally-cracked-carbon-capture-5695836/
IPCC 5AR 2014: Climate Change 2014: Synthesis Report. Contribution of Working Groups I, II and III to the Fifth Assessment Report of the Intergovernmental Panel on Climate Change [Core Writing Team, R.K. Pachauri and L.A. Meyer (eds.)]. IPCC, Geneva, Switzerland, 151 pp.
Kelly MJ, 2016. Lessons from technology development for energy and sustainability. Materials Research Society Energy and Sustainability 3:2-13. doi:10.1557/mre.2016.34
Kimbal BA, et al 1993. Effects of increasing atmospheric CO2 on vegetation. Vegetatio 104 65-75 (1993) http://link.springer.com/article/10.1007/BF00048145
Landcare Research, 2017. http://www.landcareresearch.co.nz/science/greenhouse-gases/agricultural-greenhouse-gases/methane-emissions
Lewis N. and Curry JA, 2015 The implications for climate sensitivity of AR5 forcing and heat uptake estimates. Climate Dynamics 45 1009-23
Leyland B, 2017. Personal communication from the author of Small Hydroelectric Engineering Practice
MBIE, 2016. http://www.mbie.govt.nz/info-services/sectors-industries/energy/energy-data-modelling/publications/energy-in-new-zealand/energy-in-nz-2016.pdf see Table B2 on page 14
McKinsey, 2010.
file:///C:/Users/User/Downloads/Impact%20of%20the%20financial%20crisis%20on%20carbon%20economics
Merlin-Jones D, 2012. The Closure of the Lynemouth aluminium smelter: an analysis. Civitas (Institute for the Study of Civil Society), http://www.civitas.org.uk/content/files/aluminium2012.pdf
MFE, 2010. http://www.mfe.govt.nz/sites/default/files/media/Land/land-use_0_0.pdf
MFE, 2016.
MPI, 2017. https://www.mpi.govt.nz/funding-and-programmes/forestry/afforestation-grant-scheme/
News Bulletin, 2017. http://www.stuff.co.nz/business/farming/74217741/Paris-climate-talks-NZ-agricultural-greenhouse-gas-emissions-a-tough-nut-to-crack
NIWA, 2007.
NZFFA, 2017. http://www.nzffa.org.nz/farm-forestry-model/case-studies/mcintoshes/mcintoshes-estimated-costs-of-planting#
NZ Geothermal Association, 2013. http://www.nzgeothermal.org.nz/emissions.html
NZMIA, 2016. http://www.mia.org.nz/Portals/0/MIA-Sales%20Data/Vehicle%20Sales/EV/EV%20Stats%202016%20October%20YTD.pdf
NZMOT, 2009. http://www.transport.govt.nz/assets/Import/Documents/Scrappage-Report-FINAL.pdf
NZMOT, 2015. http://www.transport.govt.nz/assets/Uploads/Research/Documents/Fleet-reports/The-NZ-Vehicle-Fleet-2015-final.pdf
NZ Stats, 2013. http://www.stats.govt.nz/Census/2013-census/profile-and-summary-reports/qstats-housing-mr.aspx
NZWEA, 2012. Wind Energy: the growing role for wind energy in New Zealand’s electricity. The New Zealand Wind Energy Association.
http://www.windenergy.org.nz/store/doc/Wind_Energy_2030_Document_Web.pdf This report states that Government forecasts say that electricity demand will grow at an average rate of 1-1.2% per year out to 2030 (from 43,000 GigaWatt hours to 52,000 GWh, an increase of about 21%). Since 2010 it has decreased by about 0.5% a year. The projections on which enhanced take-up had the wrong sign in the event.
NZ Wood, 2013. http://www.nzwood.co.nz/wp-content/uploads/2013/08/WPAScienceandInnovationPlan.pdf
Philly.com, 2015. http://www.philly.com/philly/blogs/home_and_design/Newark-NJ-to-get-worlds-largest-indoor-vertical-farm.html
Physics, Otago, 2008. http://www.physics.otago.ac.nz/eman/hew/ehome/energyuse.html
Popular Technology, 2017. http://www.populartechnology.net/2009/10/peer-reviewed-papers-supporting.html
PureAdantage, 2017. http://pureadvantage.org/news/2016/04/22/our-forest-future/
Radio New Zealand, 2017. http://www.radionz.co.nz/news/national/302509/huntly-power-plants-to-stay-open-until-2022
Scott SA, 2015. Cambridge University Engineering Department, private communication, and lecture material for Engineering Module 4M18, Present and Future Energy Systems, led by MJK from 2012-15
Smith P el al, 2008. Greenhouse gas mitigation in agriculture. Phil. Trans. R. Soc. B363, 789–813
Service RF, 2016. Cost of carbon capture drops, but does anyone want it? Lure of technologies could fade with Trump administration. Science 354 1362
Statistics New Zealand, 2013. http://www.stats.govt.nz/Census/2013-census/profile-and-summary-reports/commuting-patterns-auckland/commuting-modes.aspx
Statistics New Zealand, 2015. file:///C:/Users/User/Downloads/commuting-wtn.pdf See figure 4 on page 11
Stuff.co.nz, 2013. http://www.stuff.co.nz/business/money/9232238/Storms-wreck-retirement-investment
Tenner E, 1997. Why Things Bite Back: Technology and the Revenge of Unintended Consequences. Random House New York, pp 431
Tradingeconomics.com, 2017. http://www.tradingeconomics.com/
UKCIH, 2015., file:///C:/Users/User/Downloads/planning_for_walking_-_long_-_april_2015.pdf
UKERC, 2006: Peak share of intermittency: the best reference is from the UK Energy Research Centre:
file:///C:/Users/User/Downloads/The%20Costs%20and%20Impacts%20of%20Intermittency%20(1).pdf
Here are two key paragraphs:
- System balancing entails costs which are passed on to electricity consumers. Intermittent generation adds to these costs. For penetrations of intermittent renewables up to 20% of electricity supply, additional system balancing reserves due to short term (hourly) fluctuations in wind generation amount to about 5-10% of installed wind capacity. Globally, most studies estimate that the associated costs are less than £5/MWh of intermittent output, in some cases substantially less. The range in UK relevant studies is £2 – £3/MWh.
- These estimates assume that intermittent generation is primarily wind, that it is geographically widespread, and that it accounts for no more than about 20% of electricity supply. At current penetration levels costs are much lower, since the costs of intermittency rise as penetrations increase. If intermittent generation were clustered geographically, or if the market share were to rise above 20%, intermittency costs would rise above these estimates, and/or more radical changes would be needed in order to accommodate renewables.
Waterencyclopedia 2008 http://www.waterencyclopedia.com/Bi-Ca/Carbon-Dioxide-in-the-Ocean-and-Atmosphere.html
Wikipedia: Carbon capture 2017 https://en.wikipedia.org/wiki/Carbon_capture_and_storage
Wikipedia: Carbon cycle 2017 https://en.wikipedia.org/wiki/Carbon_cycle
Wikipedia Carpool, 2017. https://en.wikipedia.org/wiki/Carpool
Wikipedia: Cycling in the Netherland, 2017. https://en.wikipedia.org/wiki/Cycling_in_the_Netherlands
Wikipedia: GDP by Country, 2017. https://en.wikipedia.org/wiki/List_of_countries_by_GDP_sector_composition
Wikipedia: Greenhouse gas 2017 https://en.wikipedia.org/wiki/Greenhouse_gas
Wikipedia: Transport in Portland Oregon, 2017. https://en.wikipedia.org/wiki/Transportation_in_Portland,_Oregon
Wollenberg E et al, 2016. Reducing emissions from agriculture to meet the 2 °C target. Global Change Biology, 22 3859-64 see http://onlinelibrary.wiley.com/doi/10.1111/gcb.13340/abstract
PART 2: The Response of the Royal Society of New Zealand
First referee’s comment:
The paper aims to extend the Royal Society’s Report: Transition to a Low-carbon Economy
by assessing the Report’s recommendations against three criteria:
- New Zealand’s capacity to reduce carbon dioxide emissions
- Their relative value for money
- New Zealand’s ability to afford each recommended action.
All of these are worthwhile objectives and would make a valuable contribution.
In summary:
- For the most part, the paper seems to me to achieve the first objective. I am not an engineer, however, and the Editor may need to be assured that these conclusions are justified.
- I believe any attempt on the second objective must be qualified with greater caution and respect for the uncertainties involved. I do not believe that the attempt to use the cost of Carbon Capture and Storage as a benchmark against which other strategies are assessed is tenable for reasons noted below.
- The third objective requires much more elaborate assessment than is offered here.
What is needed is a comprehensive cost-benefit analysis stretching over a long horizon that must also deal in some way with the consequent problems of discounting future values. I suggest that this is a major piece of analysis and would better be attempted in a separate paper.
- Given its broad scope, the paper is forced to make many assertions of fact. These need to be supported with references to sources where they may be verified.
- At times, the paper uses the language of a proselytiser, anxious to debase conclusions of the Report. This does not add to the paper’s credibility.
- I also offer a list of drafting suggestions
- Assessing capacity to reduce emissions (objective 1)
- Capacity to meet electricity generation needs. The analysis on p4 concludes that current trends will result in 90% use of renewable sources by 2025, and hence that no further encouragement of renewables is needed. An assessment of future growth in electricity demand is needed to secure this conclusion.
- Assessing relative value for money (objective 2)
- The use of CCS as a benchmark (p4) is unconvincing. The CCS industry’s own assessment (Global CCS Institute, 2016) is that current CCS capacity stands at about 2% of what is required to absorb carbon emissions. For CCS to be a substitute for all other strategies, an argument is needed that CCS is capable of upscaling in the short period of 10-20 years. I do not know of such an argument. Also, the costings offered on p4 are speculative. For both reasons I do not see that CCS can be used as the benchmark against which other strategies are assessed.
- Priced valuations of the technologies of GHG reduction and substitution have shown themselves to very dynamic. They are also subject to future changes in policy (e.g. carbon pricing or tax) that cannot be predicted with confidence. Under these circumstances, valuations must be accompanied by an assessment of the range of future price movements and possible changes in policy. I recognise that this is a big ask, but without it the assessments offered in the paper will not convince the reader. Offering prices for carbon with no explanation ($100, p4; or $60 p14) only serves to reduce the analysis to speculation. The same applies to the discussion of transport vehicles where the discussion proceeds through several unsupported assumptions.
- p2 refers to the possibility of buying carbon credits offshore, where greater reductions in GHG may be achieved at lower cost. Given the history of rorts that destroyed the UN carbon-pricing system, a more complete discussion is needed here, or at least recognition of the moral hazards involved.
- Assessing “ability to afford” (objective 3)
- Here the paper estimates the investments required to support each GHG-reduction strategy. In some cases (pp4 and 14), but not all, the ratio of CO2 reduction to investment is given, and might serve as a measure of the relative efficiency of investments.
- In one case (foot p9) the analysis seems to expect investment payback within one year.
- In one case (p5), the loss in value of retired coal-fired milk drying is noted. This appears to question “ability to afford”. A full analysis of future costs and benefits might nonetheless conclude that the loss in capital value is more than recovered in future net benefits, leaving these as stranded assets.
- These measures do not answer the question of “ability to afford”, i.e. whether the investment produces a positive return. For that, a comprehensive cost-benefit analysis is needed, stretching over a long horizon that must also deal in some way with the consequent problems of discounting future values. I suggest that this is a major piece of analysis and would better be attempted in a separate paper.
- To compare GHG-reducing investments to other uses of money that would deliver “productive things in the here and now” (p17) is to ignore the needs of future generations. Some discussion defending this stance is needed.
- A somewhat related point (p16), “Air travel in terms of emissions per kilometre travelled is very efficient”. Efficiency in this sense is not relevant to the argument of the paper. The objective function relevant to the paper is the cost of reductions in GHG.
- Please provide sources for the following Most of the man-made carbon dioxide emissions in the world come from electricity production (from coal and gas-fired power stations) and transport. (p4) Renewables as we know them today will produce <5% of world energy in2035. (p3) a figure that could reduce to $40M by 2015 (p5)
Improving the turbines for hydo electricity will have a small 2-3% efficiency gain and a negligible reduction of CO2 emissions: decision on upgrades will be made on hydroengineering and economic grounds only, so it is only the others we need consider.
Indeed, from the data in (3.1) above, it is really only the 16% of electricity generated by gas, 12% by geothermal and 3% by coal that needs consideration. The share of gasfired electricity has been decreasing since 2012, contributing to the sharp drop in CO2 emissions.
(p5/6) Most of the hydropower stations in New Zealand have turbine efficiencies between 90 and 94%, generator efficiencies of 98% or better and hydraulic losses amounting to 5 to 10%. (p6)
The developing of infrastructure for cycling and pedestrians have [has] a negligible impact on CO2 emissions, (p7)
The hassle factor in terms of being tied to journey times and companions is very heavy. … This scheme comes into the realm of personal behaviour and will not change on less than extreme economic grounds, but only by peer pressure, and a societal view that solo driving is deeply antisocial. (P10)
The global technical mitigation potential from agriculture (excluding fossil fuel offsets from biomass) by 2030, considering all gases, is estimated to be approximately 5500– 6000 MtCO2-eq. /yr , with economic potentials of approximately 1500–1600, 2500– 2700 and 4000–4300 MtCO2-eq. /yr at carbon prices of up to 20, up to 50 and up to 100 US$ per t CO2-eq. , respectively (p13)
At the outside it [forest cover] could double, by impinging on all but the most productive agricultural land.
(p14) General improvement in personal attitudes and changes in personal behaviour can have a significant effect on CO2 emissions if only in the context of significant reductions (e.g. halving) in the demand for energy for mobility, communications and information, warmth, safety etc. that characterise a civilised society. The subset of all these actions that is technology based in terms of CO2 emissions savings are[is] small. (P16/17) annual spent of $10B is clearly an upper limit of an insurance premium for future climate change at the present time. (P18)
- Proselytizing argument • Examples of proselytising language: economic folly (p2); ! (p2); is to ignore reality (p3); we are wasting money (p4)
- “we have assumed that mitigation of carbon dioxide is a good thing, and essential to ward off future climatic disasters, even though this is not proven.”
(p19). If a criterion of proof is to be introduced, it must be accompanied by a discussion of its relevance to the task of controlling emissions, and acknowledgement of the reasons why the IPCC uses probabilistic assessements.
- The opinions of Stott (p20) need to be balanced with the conclusions of the IPCC
- Drafting improvements
Please give full name for EECA P5 The remainder of this section summarises further insights on biomass coming from a 2007 NIWA study
P6 Sophisticated supply-side intervention would not be necessary if tariff structures better reflected economic costs of production.
The following on p 3 is repeated “The World Bank predicts a further 2.5B people joining the middle class by 2035, and BP estimate a further increase of 40% in global energy demand in a world economy that has doubled in size.”
P7 “Rework this whole section”–[agreed. The following paragraph is a catalogue of data leading to no apparent conclusion] P8: “We need to compare this with business as usual which shows the continued improvement in the fuel efficiency and reduction of CO2 emissions as the counterfactual.” [unclear, please expand]
The following statements are too obvious. However the possibility of behaviour change alluded to is given discussion later (p19) and it would help to refer to that discussion on
pp10 and 11.
- Labelling of itself does not reduce emissions, and cannot be claimed to without risking serious double counting, but may encourage behaviour change the results of which will be captured elsewhere. (p10) [Strategies included in Transition to Low Carbon Economy are not claimed to be independent and additive]
- Also “Educating and training of itself does not reduce emissions, but may encourage behaviour change, the results of which will be captured elsewhere”
(p11) Similarly obvious is: “Exploring the potential and developing alternative land-uses do not of themselves lower greenhouse gas emissions” (p14). [The question begged here is what kind of land-use changes does the Royal Society report have in mind? Reference here to the paper’s discussion of agriculture and forestry would serve to advance the argument].
“Commercial buildings are much more heterogeneous, and fewer but bigger – hotels, hospitals warehouses, office blocks, retail outlets, schools, etc. “(p11). [I don’t see that this contributes to the argument of the paper. Suggest expand or delete]
“A major international study (Smith et al 2008) shows that if agricultural lands occupy 37% of the earth’s land surface”. P 13 [sentence incomplete]
The cost-benefit analysis is hard to make in comparison with the next section and for forests, but should be attempted. (p13) [develop argument – explain why CB is hard here]
It is important that these numbers are rechecked. (p14) [a drafting job still to do?] the implied CO2 saving here are book-kept with the planting, and just as seen in using wood and bio-mass for electricity production, and clippings from the forestry that are then burned release CO2 and constitute a fractional negative savings. (p15) [unclear please re-write]
Second referee’s comment:
Page numbers refer to the number at top RHS of the manuscript. The paper is a compilation of the author’s views on the title theme. In it he examines the decarbonising task for New Zealand, narrowly conceived as an engineering project, rather than a programme of managing risks in the face of uncertainty. These comments highlight a number of examples where I consider that the discussion is not satisfactory.
P1 “Here I review the international context in which carbon dioxide emissions reductions are being undertaken, in the (unprovable) hope that future harmful climate changes will be averted.” The use of the adjective “unprovable” with the noun “hope” is ungrammatical.
P2. The reference to Professor R Sim FRSNZ is incorrect. This should be CRSNZ.
P2 “A cost-benefit analysis of the proposed actions, viewed as engineering or comparable projects helps to radically reshape the suggestions made in the report …” The response to climate change is about the managing risks when the facts and the costs of action and inaction are uncertain. The author implies that this can be treated as an engineering project, but does not justify or discuss this. He also appears to favour carbon-capture and forestry, rather than strategic investment in economic change, but he doesn’t justify that.
P2 “and the poor electricity consumers are paying” is emotive writing.
P2. The reference Mackinsey 2010 should be McKinsey 2010.
P3. “A sense of this reality must be reflected in decisions on taking actions to mitigate New Zealand emissions.” This implies that responsibility to act on GHG emissions scales with population. Under this principle any region with a population of a few million could claim to be too small to matter, voting in an election would be pointless and printing $1M of counterfeit money would be harmless. This notion raises moral, ethical and political questions but the author does not address them.
P3. “Renewables as we know them today will produce <5% of world energy in 2035 (this can be read from the BP data and others have published similar material).” To imply that the BP World Energy Outlook 2015 projection for renewables to 2035 is authoritative and reliable is unsafe.
P3, “To persist with the notion of zero global carbon emissions by 2050 in the face of this real world evidence, and the progress of the last 20 years expanded into the next is to ignore engineering reality.” The suggestion that BP projections represent “real world evidence” is fatuous and the idea that the last 20 years can be “expanded” into the future is not “engineering reality”. This discussion does not meet acceptable standards for rigour.
P3. “Note that a trebling of reforestation activities would largely eliminate the net greenhouse gas emissions.” The author notes that reforestation reduces net emissions while the forest is growing, but he does not take into account of the legal framework within which forestry carbon is traded and managed.
This is occurs again on p 15: “The important aspect of forestry is that every thirty years the forest can be harvested, and subsequently replanted, and present exports could be doubled from over $5B to more than $12B under the above scenario, offsetting the initial outlay.” Under current rules, most of the carbon in a plantation forest is deemed to be converted to CO2 at harvesting, although this depends on a number of factors. The main impact of reforestation is to defer the emissions liability for a few decades.
This matter arises again on p 16 where the author claims that an increase in sawn timber production would be a good thing. His subsequent conclusions (p 18) are unsafe.
On p 19 the author again fails to acknowledge that when a forest is harvested the carbon credits are normally surrendered. So either the author’s case for forestry is flawed or he has not explained his ideas sufficiently. Yet this is his top suggestion for NZ to mitigate its GHG emissions (p 21). Far from being “compelling”, the case for reforestation is unconvincing as presented.
Pp 5 – 7. The author provides some unfocussed discussions on a range of topics, with little supportive evidence, little novelty and little specific guidance.
P7. “One cannot let intermittency exceed about 20% of the total without needing expensive back-up measures to guarantee supplies (UKERC 2006).” This is an old reference for a rapidly moving technology and the author’s comments on DSM are also dated.
P7 -9. The section on vehicles should be more selective, focus on what is novel, come to the point more quickly and provide clear evidence based conclusions.
P11. To suggest that health benefits from retrofitting buildings are just “co-benefits” is nonsense. The economics of domestic building retrofits are dominated by the health benefits and the co-benefit is the potential CO2 saving.
P11. Statements such as “Educating and training of itself does not reduce emissions” are enigmatic and vague. There are similar statements elsewhere, such as P 15: “Exploring the potential and developing alternative land-uses do not of themselves lower greenhouse gas emissions.” and P 10 “Labelling of itself does not reduce emissions”. The author presents these claims as if they are novel insights, the implication being that the proposed activity is pointless. The author does not explain what he means clearly and doesn’t provide supporting evidence.
P12. He uses 17 year-old data for the breakdown of GDP. This is silly. P 14. “This again raises the question of whether investments to reduce CO2 are better made overseas rather than at home to maximise the New Zealand contribution to the actual global problem.” The author implies here that New Zealand’s aim is “to maximise the New Zealand contribution to the actual global problem”. He does not cite any evidence that this narrow framing of NZ’s involvement in GHG mitigation is relevant or appropriate.
P21. The author does not explain why he presents temperature data from Christy UAH in Figure 4 in preference to other sources.
My response to these reviewers:
REVIEW REPLY BY M J KELLY TO THE REFEREE’S COMMENTS.
First, I think the referee for his/her (I will assume he from now on) considerable efforts, and the time he has taken. I am quite happy to be judged on the three criteria he has chosen, but have refined the third of these because of his comments.
I first comment on his six summary points and then I comment on his more detailed critique.
Comment to summary points:
(1) I note that I have only had one referee’s report, and I hope that there is one engineer as referee. Otherwise I could take umbrage that an engineer with my background and experience needs to be double checked, given the points I make about engineering integrity throughout the paper and in Kelly (2016) which has already been peer reviewed and published.
(2) This is where I simply flatly disagree with the referee and let me rehearse the simple engineering project management arguments about my case. Please note that I have not benchmarked the relative costs against carbon capture and sequestration, but only carbon capture. This is deliberate as simple thermodynamic arguments can be deployed to calculate the energy and cost of carbon capture. Furthermore, carbon capture is the biggest single opportunity to make global falls in the man-made contribution: 40% of all emissions as of now come from coal fired power stations, and the costs of capture of $60-90 per tonne, dropping by a factor of three by 2025 are widely in the literature, and I have given sample citations in my paper already that cover this range. Each time I use a value in that range, I cite the actual value so that anyone can reproduce my results. The issue he makes is a scale up one, which is exactly the same argument about renewables. The scale up is simply a matter of will – there are no unknowns as to costs of carbon capture. There are remaining unknowns about the lifetime of renewables to add to the certain poor comparative energy generation I discussed in detail. The sequestration is another matter, which is why I did not use it. The initial costs now are lower than they will be later on as more difficult sites are used. I add a comment to point out that I am emphasising what needs to be done in the next decade, not all the way out to 2050, when many things will change. [I emphasize that the analysis here is in terms of engineering (and other) projects to reduce the CO2 emissions over the next two decades, and not a century long discounted analysis of present investments. That is for someone else to perform.] The point of the paper is to show that in the near term, the alternatives to carbon capture from coal fired power stations at (often much) greater costs is an unwise use of precious resources. To argue otherwise is to misuse engineering project economics.
I would be happier if the referee had given an alternative basis on which to make comparisons. The economists at the Ministry for the Environment were particularly grateful for the analysis of what I had done as it gave them a clear steer among and between the many, otherwise unquantified, suggestions made in the original paper.
(3) My focus is on what happens in New Zealand in the coming decades. The facts with respect to (2) above stand. The relative costs of actions are estimated but the errors are not enough to change ‘yes’ into ‘no’, wherever I have made specific statements. I have emphasised that my paper is the start of the literature on the subject and I am happy to have the arguments developed further in the future. Not to make the statements I have made here is to emasculate the impact of the paper, turning it in to an abstract academic exercise and not solid engineering advice to be considered by readers in the real world.
The referee does not like the ‘ability to afford’ argument: I shall stick closer to my expertise and referred to the wisdom of current investments. (New Zealand could afford to gold-plate the parliament building.) I am talking each time about the wisdom of being profligate with money in terms of reducing GHG emissions and the implied opportunity costs of doing something that is several times as expensive as it needs to be to achieve the same end. I have more to say on this below. The approach here is to regard the different forms of GHG emission reductions as alternative engineering projects that have to be permitted and the finance raised, and I have looked and the cost-benefit ratios between the different projects in the near term. It is a legitimate, but different, argument to talk about other economic considerations. I have stressed this point in the introduction.
(4) I have already shortened the original paper, and I will add references, but I note that some that the referee asks for are already in the paper if he were to read the actual references. This inevitably lengthens the paper, to nearly 14200 words.
(5) I specifically tried to remove the language of proselytising, but I do have important points to make that go against the grain of what I consider lazy analysis that is commonly accepted. It is language I have had published before (Kelly 2106) I am not trying to debase the concept of the report, but rather to say that an unquantified shopping list with no value-for-money estimate at all, let alone an approximate one, and no triage, is of no use to the nation. This was reinforced to me as a key value of the paper when I called to see economists at the Ministry for the Environment trying to actually work on New Zealand’s carbon emissions reduction.
(6) I have acted on all the points made.
Comments on the detailed points:
(1) I made a specific qualification to cover my statement that current trends would continue. I have added a further qualification
(2) I profoundly disagree (as described above), and would have had a better debate if the referee had an alternative scheme. I did not use CCS because of uncertainties, but only CC about which there are no uncertainties in terms of the cost and energy penalty, as I describe in the text.
I also fundamentally disagree with that the costs of technology depend on policy. The policy is a matter of economics. If we insist by policy that only renewable energy can be used, we can still calculate the costs on an engineering basis. We can then show whether the policy makes economic sense or not. A few years ago, against engineering advice, biofuels from corn were advocated as a matter of policy. Engineers early-on showed that the energy return on investment was very low, now shown to be less than unity, and the consequential food riots in Mexico and elsewhere and the continued destruction of Indonesian rain forest were a consequence of a policy where the early arguments about the engineering integrity of the policy had been ignored.
I agree with the last comments on rorts on UN projects, but, as I have just stated, they have nothing to do with the engineering integrity of the carbon-pricing system, rather they are an abuse of engineering integrity on behalf of their advocates.
(3) Nearly all the comments here ask for more material and I am already constrained. I am concerned about how the referee introduces ‘ability to afford’ here. There are many things that NZ could afford, but if they are paying several times more for something for which there is an alternative to achieve the same aim (in this case GHG reductions), it seems imprudent to pay the excess, on the grounds of reducing GHGs. For each of the six bullet points listed I note as follows:
- I have tried to make the estimate for all the forms of GHG reduction, and the referee does not instance where I have not. Indeed, the benchmark to Carbon capture as the common currency allows the relative efficiencies to be established and that is I think what I made clear in the paper.
- Point taken and amended.
- The referee introduces a ‘second order economics argument’ which if done for one, must be done for every item, but this is another paper for another author. The points I make about the relative merits of the different ways of reducing GHGs stand, as made.
- I repeat that this is not the argument about ‘able to afford’.
- I add a sentence, as I do not want to get into the vexed question of discount rates about which economists disagree strongly see Stern, Das Gupta, Sen …. As I mentioned above, I have added a statement that I am focussing on actions in the coming decade or two.
- The statement made is true as between air travel and other forms of travel. Those who expect dramatic rather than incremental increases will be disappointed. The comment of the referee is also true and I refer back to what I was trying to do.
(4) I am asked to give sources for several facts. Here I am concerned that the referee has not taken in the full extent of the paper because most (but not all) of the conclusions can be read off the figures already given! In many places, I say that I have made the estimates – so why reference myself?
The referee has 11 comments and I answer these in successive bullet points: where I have an asterisk, I have made a cosmetic change to reduce any ambiguity
- Man-made emissions: See IPCC *
- This can be read of my figure 1a of Kelly (2016)
- In the paragraph above the one the referee cites, I have mentioned that extracting CO2 from coal fired power stations is ~$100/tonne today and due to come down to ~$25 by 2025. The statement the referee queries follows directly from that ratio.
- I have given the reference. Private communication, Bryan Leyland
- Development of infrastructure – this is so obvious, given that it is much smaller than existing roads.
- I have a reference in the next paragraph so I have run them together.
- The reference is in the same [paragraph at the beginning rather than at the end!!!
- I have analysed the land use data cited in the same paragraph.
- That is the logical conclusion of reading all the data. I propose not to reference myself.
- That is my estimate, and that is precisely what I way it is and how I arrived at it.
(5) Proselytising language: What I say is true and has the evidence to back it up. I reject the referee’s comments.
Folly is folly (or nonsense or ….). My reference (Kelly 2106) makes just these points is these, if not stronger, terms. Misspending money is wasting money. Engineering nonsense is a descriptive term for projects that do not make sense in engineering terms (that include economic as well as scientific connotations). On Stott, I can cite 1000 other papers that agree with him. (Small change made).
6: Drafting points: I have accepted and worked on all these.
Appendix: report from Referee 2 with my comments in italics
DECARBONISING THE NEW ZEALAND ECONOMY: A REALITY CHECK
The paper is a compilation of the author’s views on the title theme. In it he examines the decarbonising task for New Zealand, narrowly conceived as an engineering project, rather than a programme of managing risks in the face of uncertainty. These comments highlight a number of examples where I consider that the discussion is not satisfactory.
Response: My views are very much suppressed. The emphasis is on facts, and it seems that this referee chooses to neglect the numbers and facts.
Remember I said I would start a literature on the material behind the original RSNZ report.
Even with a programme that is about managing risks, you do not build a Tower of Babel, you undertake a finite number of engineering projects. This is a reality this reviewer does not accept.
P1 “Here I review the international context in which carbon dioxide emissions reductions are being undertaken, in the (unprovable) hope that future harmful climate changes will be averted.” The use of the adjective “unprovable” with the noun “hope” is ungrammatical.
As a matter of fact, can one prove that the emissions reduction will prevent climate change – show me the proof. Until the proof is available, it remains unproven here as elsewhere in science and engineering.
One undertakes measure of emissions reduction with the hope of averting future climate change. You cannot use the world expectation as there is no line of logic that leads from reducing emissions to actually reduction in climate change. My logic is impeccable.
P2. The reference to XXXXXXX FRSNZ is incorrect. This should be CRSNZ.
I have had personal correspondence with XXXXX – it was he who told me that the team had not done a cost-benefit analysis, as there was no literature. I had no dealings with CRSNZ on this matter, so it would be an error to cite them.
P2 “A cost-benefit analysis of the proposed actions, viewed as engineering or comparable projects helps to radically reshape the suggestions made in the report …” The response to climate change is about the managing risks when the facts and the costs of action and inaction are uncertain. The author implies that this can be treated as an engineering project, but does not justify or discuss this. He also appears to favour carbon-capture and forestry, rather than strategic investment in economic change, but he doesn’t justify that.
“the costs of action and inaction are uncertain” – of course they are and I have had the confidence to make initial estimates of the costs of action and inaction, as I explained in my paper. Carbon capture and forestry represent a positive return on investment, whereas most of the strategic investments in economic change will not succeed. The record number of wind and solar bankruptcies following a cut-back of stopping of subsidies is the clearest possible evidence. Every week over the past month (as of 21/07/21017) there have been new examples in Canada, Japan and elsewhere.
P2 “and the poor electricity consumers are paying” is emotive writing….
Poor means impoverished, not unfortunate – it is a technical term and not an emotive term, given the context of the sentence, unless one wants deliberately misread. I can easily handle that, by moving the word in the sentence
P3. “A sense of this reality must be reflected in decisions on taking actions to mitigate New Zealand emissions.” This implies that responsibility to act on GHG emissions scales with population. Under this principle any region with a population of a few million could claim to be too small to matter, voting in an election would be pointless and printing $1M of counterfeit money would be harmless. This notion raises moral, ethical and political questions but the author does not address them.
When I show that China is 260 times bigger in scope than New Zealand, any engineer would rest the case. NZ should do what it can but not at the expense of ruining itself. I show that the majority of suggestions in the RSNZ report are economically unsound, and that there are a few economically sound ones. I am writing a report on the engineering and economics of the issues, and NOT the morality, ethical and political questions, which have no place in a scientific journal. This statement alone disqualifies the referee in terms of integrity as a scientist. I am not writing a pamphlet, but a factual analysis.
P3. “Renewables as we know them today will produce <5% of world energy in 2035 (this can be read from the BP data and others have published similar material).” To imply that the BP World Energy Outlook 2015 projection for renewables to 2035 is authoritative and reliable is unsafe.
The BP data up to 2107 is real and actual data. BP, other companies and the World Bank use the BP statistics which Are regarded as authoritative by the international commentariat. It is as well for BP as any other company to be as accurately informed on all aspects of its business for its own survival. BP data is used by many in the environmental movement because it has been proven accurate in the past.
P3, “To persist with the notion of zero global carbon emissions by 2050 in the face of this real world evidence, and the progress of the last 20 years expanded into the next is to ignore engineering reality.” The suggestion that BP projections represent “real world evidence” is fatuous and the idea that the last 20 years can be “expanded” into the future is not “engineering reality”. This discussion does not meet acceptable standards for rigour.
Look, how one is going to go from 1-2% renewables after 40 years of R&D to more than 10% by 2050 has NOT been described by any real-world engineering activity that has to satisfy shareholders. It simply will not happen. If I am given a quote from a real-world engineer that it will happen, I will include it in this paper as a qualification. Just to show you how serious this is, there is a paper in the Proceedings of the National Academy of Scientists, making precisely the point I am making:
see: Christopher T. M. Clack et al, 2017 ‘Evaluation of a proposal for reliable low-cost grid power with 100% wind, water, and solar’ Proceedings of the National Academy of Sciences of the United States of America, published ahead of print: doi/10.1073/pnas.1610381114
in response to
Jacobson MZ, Delucchi MA, Cameron MA, Frew BA (2015) ‘Low-Cost Solution to the Grid Reliability Problem with 100% Penetration of Intermittent Wind, Water, and Solar for All Purposes.
Proceedings of the National Academy of Sciences of the United States of America 112(49):15060–15065
The former is an excoriating attack on loose analysis making ridiculous claims of the latter. The 21 respondents include several Stanford colleagues of the original author.
P3. “Note that a trebling of reforestation activities would largely eliminate the net greenhouse gas emissions.” The author notes that reforestation reduces net emissions while the forest is growing, but he does not take into account of the legal framework within which forestry carbon is traded and managed. This is occurs again on p 15: “The important aspect of forestry is that every thirty years the forest can be harvested, and subsequently replanted, and present exports could be doubled from over $5B to more than $12B under the above scenario, offsetting the initial outlay.” Under current rules, most of the carbon in a plantation forest is deemed to be converted to CO2 at harvesting, although this depends on a number of factors. The main impact of reforestation is to defer the emissions liability for a few decades. This matter arises again on p 16 where the author claims that an increase in sawn timber production would be a good thing. His subsequent conclusions (p 18) are unsafe. On p 19 the author again fails to acknowledge that when a forest is harvested the carbon credits are normally surrendered. So either the author’s case for forestry is flawed or he has not explained his ideas sufficiently. Yet this is his top suggestion for NZ to mitigate its GHG emissions (p 21). Far from being “compelling”, the case for reforestation is unconvincing as presented.
This is a matter of wilful misunderstanding. The legal framework could be rewritten tomorrow, but that does not change the physics of carbon dioxide emissions. I made clear that if forests are harvested and the wood is used in building products, that carbon remains sequester and one can reforest. The surrendering of carbon credits is an accounting convention that does not affect the actually physical and engineering state of the CO2 one iota.
I have talked with foresters about this matter. International journals come to the same conclusion and my longer report had references, but I am constrained to 14,000 words.
Pp 5 – 7. The author provides some unfocussed discussions on a range of topics, with little supportive evidence, little novelty and little specific guidance.
No examples given, so not rebuttal possible. Lazy refereeing. Unable to reply
P7. “One cannot let intermittency exceed about 20% of the total without needing expensive back-up measures to guarantee supplies (UKERC 2006).” This is an old reference for a rapidly moving technology and the author’s comments on DSM are also dated.
No-one has negated the points made by the UKERC and the stand as international norms, and is still cited. There have been no technical breakthroughs to counter this analysis, and the problems occurring in Germany are an example of this analysis coming true. It is incumbent on the reviewer to provide the counter-example while my statement stands in full and unqualified.
P7 -9. The section on vehicles should be more selective, focus on what is novel, come to the point more quickly and provide clear evidence based conclusions.
I agree. I have removed two long introductory paragraphs and left the central focus on electric cars.
P11. To suggest that health benefits from retrofitting buildings are just “co-benefits” is nonsense. The economics of domestic building retrofits are dominated by the health benefits and the co-benefit is the potential CO2 saving.
I have some personal and professional experience on this. There has to be a case to actually spend the New Zealand dollars on retrofitting houses. The narrow sense of the saving on energy bills is not enough. Health benefits are there to be saved, but no-one is willing to provide the up-front investment because of these health benefits. We tried to get that in Cambridge, UK: the already hard-pressed health authorities will free-ride on the savings as they accrue, happily using the money elsewhere. In terms of the initial engineering project, the health savings have to be regarded as co-benefits. That is the technical point I was making.
P11. Statements such as “Educating and training of itself does not reduce emissions” are enigmatic and vague. There are similar statements elsewhere, such as P 15: “Exploring the potential and developing alternative land-uses do not of themselves lower greenhouse gas emissions.” and P 10 “Labelling of itself does not reduce emissions”. The author presents these claims as if they are novel insights, the implication being that the proposed activity is pointless. The author does not explain what he means clearly and doesn’t provide supporting evidence.
I did not say that, and none of the many others who have read this make this point. The fact is how much CO2 emissions savings do we book-keep against education and training. It will be book kept against the specific actions actually undertaken to reduce the saving. That is precisely to avoid double counting as I suggested. To imply otherwise is a sign fi ill-will.
P12. He uses 17 year-old data for the breakdown of GDP. This is silly.
I covered this in the context. How has it changed since?
P 14. “This again raises the question of whether investments to reduce CO2 are better made overseas rather than at home to maximise the New Zealand contribution to the actual global problem.” The author implies here that New Zealand’s aim is “to maximise the New Zealand contribution to the actual global problem”. He does not cite any evidence that this narrow framing of NZ’s involvement in GHG mitigation is relevant or appropriate.
If the aim is not to maximise NZ’s contribution to CO2 emissions, then all bets are off. It does not matter that we are wasting money. CO2 does not have a NZ tag on its molecules. Where else in human enterprise would you pay 5-10 times over the odds
P21. The author does not explain why he presents temperature data from Christy UAH in Figure 4 in preference to other sources.
I can easily do that – there are many such data. This one has been subject to testimony under oath that is not the case in journals.
MJK Amsterdam 29.06.17
Possible referees: Richard Blaikie, Alan Bollard, Bob Buckley, Garth Carnaby and Shaun Hendy.
Reports from first resubmission based on my modifications as outlined above.
REREVISE: RSNZ M J Kelly 09-Oct-2017
Dear Professor Kelly:
Re : NZJR-2017-0037 DECARBONISING THE NEW ZEALAND ECONOMY: AN ENGINEERING-BASED REALITY CHECK
I regret to inform you that the above manuscript, submitted on 29-Jul-2017 is not suitable for publication in the Journal of the Royal Society of New Zealand. I am sorry to pass on such discouraging news about a ms that reflected substantial effort and professional insights on your part. However, three new referees, all Australasian engineers, recommended: major revision, reject, and reject. An earlier first round of reviewing recommended: major revision, and reject.
The referees have provided copious constructive suggestions and comments on content and style which appear below. These reports will undoubtedly be helpful in understanding the background to the recommendations. I expect that the reports might also help in preparing the ms for submission in a more-suitable journal elsewhere.
Thank you for considering the Journal of the Royal Society of New Zealand.
Yours,
YYYY
Senior Editor, Journal of the Royal Society of New Zealand
Referees’ reports:
[Note: unfortunately, the lines here refer to a re-typeset version sent by RSNZ to the reviewers, not my original text.]
First reviewer: Kelly v2 R2-1
Review of NZJR-2017-0037
Recommendation: major review
The title of the paper was very encouraging. An engineering-based reality check is justified. I read the RSNZ report myself soon after it was released as was quite disappointed how it trotted out the same old textbook content with little analysis of effective options. It read as if RSNZ were afraid to tackle the real issues for fear of getting offside with their funders. My own view was that it was best left to die a natural death, but I’m pleased to see an attempt at a review.
However, as the paper is currently written, the title would best be “…: Another engineer’s opinion”.
The review would benefit a lot by aiming to prioritise or rank different options. After reading it I am still unclear about which options the author proposed. I suggest that the author create a table showing the costs of each strategy. If no cost can be estimated, it might be better to significantly reduce the number of words in the corresponding section. Another similar approach is to estimate the carbon charge that would be required to achieve each reduction.
Given that this is supposed to be an engineering-based check, unsupported views of the author and other commentators should be sparse.
Comments which are not well supported include:
line 66: “in transport round half the world”. Based on Mackay (2008) the shipping energy from London to Auckland is similar to trucking energy from Cambridge (UK) to Munich.
207 “The case for weaning food processing off coal” is more emotive than technical. 680 “in the grand scheme of things”
743 “is money not spent on productive things in the here and now”
- change to “is projected to use 2% more energy …”
193 This paragraph is a view often stated by “international experts”. It is incorrect for NZ. Instead one could write: “New Zealand is well placed for use of intermittent solar or wind sources because of extensive hydro storage and quickly responding spinning reserves.” My understanding is that we have 100’s of MW of fast instantaneous reserves and more of sustainable instantaneous reserves available within 60 s.
- There is no need to repeat this. The inclusion of this once, let alone twice, shows a nit picking approach. Yes geothermal power emits CO2 but as stated on line 242/3 it is not worth chasing and capture is not needed.
- There is no need to consider inflation. Only real cost increases need to considered.
327 – 339 This is unnecessarily negative. The costs are current but are reducing rapidly. 5 times battery replacement is very pessimistic. Some website (you can google them) say over 300 000 miles might be possible before replacement (of the car). The infrastructure costs are likely to be much less than the continuing replacement of petrol stations.
374-375. “In time …” this type of opinion has no place here.
- No reference. Data from https://data.london.gov.uk/dataset/travel-patterns-and-trends- london gives in 2012 millions of travel stages per day. Not only does public transport out number private (assumed to be cars), but private is only about 1/3. Yes the statement in the paper is correct “public transport still accounts for a minority of daily journeys” but it is totally misleading and has no place in a paper like this.
Public transport
Private transport
Walk
Cycle
2012
13.41
10.10
6.26
0.58
424 – 426. I realise the author is trying to comment on every section, but this comment is of little engineering value.
443 avoid using “fact” unless it is.
478 – 481. I suspect this is overstated. Is there any supporting evidence?
737 – 759. The author compares climate change with events of chance. In this way he is proposing an opinion that climate change is as unpredictable as earthquakes or volcanoes. The view of most scientists and engineers is quite contrary; climate change is very, very likely and any responsible government must act accordingly over some time scale. Here the authors offers too much opinion.
- Please use either t CO2 or t C, but not both.
I was surprised that the aluminium smelter was not mentioned. While some people see this as a potential source of reduction, any closure would merely export CO2 emissions to another part of the globe, and probably add more. This is worthy of comment.
Grammar
Avoid excessive use of “Note that”. If it is not worth noting please leave it out. We are trying to move away from language such as “man-made”. Anthropogenic or human might be better.
601 “are still high”
Please use SI conventions
°C, not C
B is clearer as billion or 109.
T means tera to me. Please write as trillion or 1012.
Typography
CO2 please rather than Co2, CO2.
404 2.8 should be 3.8 411 “kilometres”
Avoid acronyms
IPPU
Second reviewer: Kelly v2 R2-2
Review of NZJR-2017-0037
Recommendation: reject
The aim of the paper to review a proposed climate policy framework for New Zealand is a worthwhile objective. There is some very interesting discussion of the limitations and challenges of particular policy proposals. It is well written in an engaging style. New Zealand also represents a very interesting context given its high agricultural emissions, LULUCF opportunities and relatively low emission electricity sector.
Unfortunately the paper would seem to misframe the challenge we face – the climate science suggests that avoiding dangerous global warming requires net global emissions to fall to zero well before the end of this century. Virtually every country in the world has, if in name only, signed on to this objective. If you assume that New Zealand intends to fairly contribute to meeting this global challenge then the question is not if, but how best, New Zealand can completely decarbonise its economy within a matter of decades. Paying for emission reductions overseas can’t buy you out of domestic action, only delay it, and not for very long. If you don’t believe that climate change warrants such decarbonisation, or it is impossible to do so then you really need to state that up front, and be clear that you are not assessing the climate policy framework against the objectives that the Society working group designed it to achieve. Section 6 of the paper makes it clear that the author is not convinced of the danger of climate change, on the basis it would seem of a few contrarian theories and websites. That’s fine, but the analysis undertaken in the paper needs to address the stated objectives of the policy proposals, or be very clear that it doesn’t intend to, which suggests that this paper should focus on the objectives being wrong or impossible to achieve across all jurisdictions, rather than the policies being proposed to decarbonise the economy being wrong.
Furthermore, while the proposed assessment framework of cost-benefit analysis has been widely applied to climate policy assessment, it is increasingly appreciated that it has inherent limitations that need to be acknowledged by researchers, and limit its usefulness. Of key importance, policy makers seeking to avoid dangerous global warming face the challenge of decision making under extreme uncertainty. Yes – as the author notes these uncertainties mean that some policies may prove ineffective, inefficient or even counterproductive. And yes, there is a small but real possibility that they aren’t even required? Such is the challenge we face. For climate change policy it is now recognised that the key policy objective is to reduce the very real risks of unchecked global warming, hence the key assessment criteria needs to be effectiveness in terms of emissions reductions, rather than efficiency in which these reductions are achieved. The costs of failure are such that spending more than you might have needed to in order to avoid what is likely extremely dangerous warming is far less of a risk than choosing a limited suite of supposedly ‘efficient’ policy instruments that may fail to deliver the necessary emission reductions in the required time frame. In the context of global warming’s ‘tail’ risk (runaway catastrophic warming), means that cost-benefit analysis is not an appropriate framework. The engineering discipline actually has much to contribute here – designing in ‘robustness’ against unacceptable failures is a key aspect of good engineering practice. Unfortunately this paper has little to contribute in this regard. Even in terms of cost-benefit analysis, failure to consider costs other than climate change limits the value of the findings – there are likely to be excellent reasons to reduce urban car use in terms of regional air pollutants quite independently of potential emission reductions.
It is unfortunate because I think there is considerable value in assessing policy options for their likely technical feasibility, possible costs, challenges and opportunities. Much of the discussion in the paper looks very useful and highlights policy areas worthy of early focus (not always the areas currently receiving policy attention). I also share the author’s concerns that the costs of some policy measures are greater than their proponents suggest. However, it is one thing to argue that EV deployment shouldn’t be a policy priority at this point, quite another to say that it isn’t worth doing at all, given that we must eventually completely decarbonise the transport sector. Finally, the author appears to be setting a backstop / benchmark abatement cost using a suggestion that CO2 capture costs may fall to 20/t by 2025. This is a very poor choice given the near complete failure of CCS demonstration to date and its very high costs. There are also inherent limitations to the technology even should its costs fall – for example, it is hard to see how it can be applied to mobile and small-scale fossil fuel combustion. The poor framing of the climate policy challenge and our options to address it really invalidates the conclusions of the paper.
Some final issues that contributed to my recommendation for rejecting the paper.
Terms such as ‘feel good’ (L62) really have no place in a scientific paper.
Leakage issues between countries taking different levels of policy action are certainly an issue. However, there are complexities that need to be acknowledged. Aluminium production has certainly moved globally over recent decades, but not only to China (hence predominantly coal-fired generation) but also the middle east (gas-fired generation) as well as jurisdictions with largely renewables based electricity (eg. Iceland). More generally, shouldn’t rich countries such as New Zealand show leadership in addressing climate change.
Equity impacts are certainly very important and not always well addressed. Again, however, there are complexities that need to be addressed. As another example, renewables are not the only reason driving fuel poverty increases in households, and there are policy options for addressing this that don’t require we allow highly polluting generation to effectively be subsidised by not having to pay for the harm that it causes. Futhermore, the costs of unchecked climate change will almost fall disproportionately on the poor.
Finally, we need to be very careful when discussing what the future will hold. As an example, growth in energy consumption over recent decades is very relevant to understanding our decarbonisation challenge but BP projections of the future energy mix should not be confused with historical data.
Third Reviewer: Kelly v2 R2-3
Review of NZJR-2017-0037
Recommendation: reject
The author has tackled a very complex issue and attempted to do so in an holistic way. For that he needs to be commended. Far too often the promotion of one or another “fix” of the climate-change issue is heralded without an adequate overview of how physical reality, economic and societal issues and the environment interact, not only now or as well as can be foreseen into the future. Indeed few scientists do such assessments with a proper risk analysis where the risk assessment, probability, of what is possible is weighed against the risk, again probability, if it does. The role of engineering and perhaps an engineering approach is accepted, but it is clear at least to me, that this is not always the most appropriate approach, so that this point needs not to be put too dogmatically.
That having been said, and despite the laudable attempt, I am reluctant to recommend the article for publication. It suffers from some major shortcomings. Much of these occur from what is clearly a limited knowledge of the science underpinning many of the issues, borne out by a very poor referencing of the literature that exists in some of the areas that the author seems to suggest he has discovered. The text sometimes indicates, by the level of assertion and exclusion, that the author’s knowledge-base is limited.
As a result I found the assertions made in this paper as unsubstantiated by the arguments in the text. Indeed, too often the text seemed no more than a dogmatic presentation of preconceived views, which perhaps may be correct, but are not proved by logic or data. The often referring to Wikipedia is, in my view, unacceptable in a scientific journal article. The onus on the author is to dredge out the underpinning peer reviewed literature and present that.
Given the challenges of what has been attempted I might have been tempted to suggest re-appraisal after some attentions to specific issues. But I think the paper needs more of an wholesale reassessment of its objectives and a more rigorous determination of what can and cannot be asserted from this work.
I found the writing skills in need to assistance, and indeed, after many hours, gave up on a detailed assessment of the text in the second half.
On many occasions, there appears to be a lack of spaces between words. This may not have been the author’s problem but simply that of the software I used to read the PDF file?
Key problematic issues with the text include:
- Very poor use of the wide literature in support of propositions
- The use of unpublished or web based information of dubious authority
- Inconsistent use of abbreviations/acronyms that may or may not be appropriate
- Incorrect use of units as per the International Standard Units
- The use of the personal “I”
- The use of jargon not appropriate for a learned journal
- A strange use of the term “engineering”.
Specific comments are as follows:
Page 1, Abstract, Line 28. Suggest replace “in the hope” with “with the intention that”.
Page 1, Abstract, Line 29. Do not use slang or in-house jargon (over the odds) but say what you mean in simple English.
Page 1, Abstract, I spend suggest removing the personalised “I” and replace with words such as “this paper”, “this study”.
Page 1, Abstract, to me “through the lens” is current jargon. Better to use simple English that says what is meant. First it is “the lens” and then it is the filter? Be consistent.
Page 1, Abstract, Line 31. Space between “wisdom” and “of”. Note there are a number of such occasions listed below that may relate to the conversion to my software.
Page 2, Line 46, “a starting point for that literature”. Do you mean that this is a first attempt at this kind of analysis and a basis for ongoing and future work? Might be worth rewording. Remove “I hope”. Not the language of a scientific paper. Not sure what is meant by “comparable projects”?
Page 2, Line 48, unmatched parentheses. Space between “radically” and “reshape”.
Page 2, Line 51-55. Long sentence that might be improved in clarity.
Page 2, Line 54, spaces between “target” and “groupings”, “namely” and “(G)”, “businesses” and “and”.
Page 2, Lines 56-56. This sentence is unclear.
Page 2, Line 58, “in the round” What is meant by this jargon?
Page 2, Line 59 and elsewhere, the 2 in CO2 should be subscripted in a scientific journal.
Page 2, Lines 60-62. I strongly agree with this sentiment, although the emphasis on “engineering reality” may be seen by some as the neglect of other realities, such as environmental, political and societal realities. I would prefer the comment to relate to holistic assessments, that include all of these factors that should be considered in a comparison of options. Further, in most issues, balance all of these “realities” leaves one with uncertainties or probabilities that make categorical decisions often impractical. The danger is that emphasis on economic and engineering realities may be considered as being too “engineering” focussed.
Page 2, Lines 62-70, The examples given here is open to series question. To suggest that this lead directly to China’s expansion (if it really exists) in the use of coal, is questionable. But in any case, from a primarily economic and globalisation consideration, why not shift activities offshore in order to achieve economic cost savings? Isn’t this part of you argument, or in any case, if this is seen as a bad thing, then this is likely due to an impact on jobs and national security which in itself is no longer an engineering or economic issue. So for me this is confused.
Page 2, Line 71, why carbon dioxide in full here and as a chemical symbol elsewhere?
Page 2, Lines 71-81. Consider depersonalising by removing “I”.
Page 2, Line 77, the use of millions and billions seems here, out of any rigorous context, seen to be little more that emotive argument not appropriate in a scientific article.
Page 2, Line 79, on has to presume you mean economic or dollar resources here?
Page 2, Line 83. Surely not necessary to refer to Wikipedia when many rigorous assessments are available in the literature? Space between “comparison” and “with”.
Page 2, Line 84-86. International Standard Units require a space between numerals and units, e.g. 7.22 t, 556 Mt CO2e. Note that M is not a standard unit and it might be better to spell out million when referring to population numbers. Note these comments apply elsewhere in the document but will not be highlighted in these notes again.
Page 3, Lines 89-94. The comparison between New Zealand emissions and those of China is nonsensical. I you really wish to do that, you should compare this on a per capita basis. It sounds like a not uncommon coping mechanism of blaming someone else, not and appropriate for a scientific journal article. Certainly in Line 91, the sue of “I estimate” is just not good enough. The reader is entitled to know how this conclusion was reached. Leave it out. What is a “sense of reality”? Almost all nations are contributing to emissions reduction, but how they contribute will and should be a reflection on a comparable levels of national wealth and wellbeing, physical and societal capability, etc, etc. You seem to be espousing a value judgement not underpinned by rigour.
Page 3, Lines 100-102. Suggest “billion” in full.
Page 3, Line 106. There are numerous attempts in the literature at projecting future energy needs. All of these expect the attainment of the UN Sustainable Development Goals to lead to the growth in the proportion of the human population with higher energy usage and the growth of the population. However, they differ substantially as to how these demands will be met, whether it be through energy efficiency, nuclear, solar or wind etc, etc, etc. Only a few are prepared to assume that projection from a near linear trend is a serious thing to do, coming to the conclusion that the only way forward is more of the same. To me this is not a rigorous review of the available knowledge, but a handpicked assessment from BP and the World Bank (and we can’t even be sure if those assessments are not already out of date). There should be a reference to the publications of the World Bank so the reader knows when, where and how these projections were made.
Page 3, Line 108-110. This is not about “engineering reality” but more to do with costs and options, vested interests and concerns. There is no concern expressed here that actually there is a risk associated with the changing climate that this is all about. That risk will not be equally assessed by all, but to deny its existence is ludicrous. The wider world is concerned that the cost associated with allowing climatic change to progress may leave the cost of new direction for our energy systems to be relatively inconsequential. But in any attempt to look holistically at energy options, it is simply not good enough to deny the existence of the key motivation for change. Indeed, the NZ Government’s international commitment is for “GHG emissions to 30% below 2005 levels by 2030”. Is that consistent with the proposition made here? If not how are these differences justified?
Page 3, Line 111. Suggest “Figure 1 presents….”.
Page 3, Line 121. “CO2” Capital O.
Page 3, Line 124. Space between “even” and “for”.
Page 4, Line 135. Is the Pure Advantage a peer reviewed, independent study?
Page 4. Figure 3. Again isn’t this inconsistent with the international agreement by the NZ Government? At least this apparent discrepancy needs comment.
Page 4, Line 144. Do better than Wikipedia.
Page 4, Line 147. Space between “fired” and “steam” and after”,”.
Page 4, Line 154. Again use the hard published literature not Wikipedia. There is a huge literature on CCS. Surely a scientific paper is not the place to report rumours.
Page 4, Line 156. Is this the place to report a suggestion? In any case, competing energy sources will likely also experience cost reduction into the future. The Australian CCS-CRC suggest a reduction of CCS costs, but a greater reduction for some renewables by 2030.
Page 4, Line 159. What are the “needlessly expensive alternatives”?
Page 4, Lines 166-167. An unpublished, perhaps un-referred, document submitted to the NZRS is not a legitimate citation for a scientific article.
Page 4, Line 169-170. What is an “engineering integrity test”? Define/explain.
Page 5, Lines 180-182. Space between “likely” and “as”. Surely a citation from a radio station is not a legitimate citation for a scientific paper. Who has examined the issue of security of supply under conditions of low rainfall years?
Page 5, Line 187 and elsewhere. Are these NZ 2017 dollars?
Page 5, Lines 194-195. Yes the issue of intermittency is dealt with in many studies, with widely different conclusions that need to be recognised here. There are also “engineering” issues related to pumped hydro options and chemical storage that need to be considered in terms of meeting demand and realistic energy cost assessments. These words are simply too shallow to reflect what is really going on globally in terms of assessment of future options.
Page 5, Lines 202. “nugatory”. Not clear in what sense this word is used here.
Page 5, Line 208. Space between “seems” and “much”. The net primary production of all NZ vegetation is about 3.36 EJ per year. Thus national primary energy needs are about 20% of this capacity. Yet this NPP is used for food production, conservation of species or heritage, water catchment, infrastructure and energy. So any estimate of what can be achieved from the utilisation of this resource needs to be viewed in terms of competition from these other uses, and the relative prices that are paid for these various outcomes. Such concerns are only underlined by the NIWA study outcomes, Lines 217-223.
Page 5, Lines 210-216. These are totally unjustified statements of fact that need proper citations for evidence.
Page 5, Lines 217. Space between “this” and “section”.
Page 6, Line 230. Space between “electricity” and “generation”.
Page 6, Line 233. What is meant by the jargon “course graining”. Not appropriate for a scientific article.
Page 6, Line 242. Space between “already” and “a”.
Page 6, Line 246. Note spaces., “: there is an extra cost associated with”.
Page 6, Line 255. Space between “with” and “more”.
Page 6, Line 259. “dry hydro years”. In years of low rainfall and a shortfall of hydro generation?
Page 6, Line 261-263. Space between “electricity” and “suppliers”. These statements about the social contract fly in the face of what is being achieved elsewhere, or more importantly what might be achieved as technologies develop over the coming decades.
Page 7, Line 272-273. Space between “demand” and “management”. Space between “suppliers” and “the”.
Page 7, Line 297. Wikipedia again!!
Page 7, Line 298. Space between “density”, “with” and “Auckland”.
Page 7, Line 309. Space between “entry” and “and”.
Page 7, Line 310. Not the use of M and K. It would be better to spell out as especially K is not the scientific abbreviation for thousands. Not a number of occasions, at least in my version, where spaces are missing between words. This analysis of the potential for the evolution of electric drive vehicles, ignores the nexus between full electric and hybrid drive, the rate at which international manufacturers are embracing electric drive options, the potential role of governments in encouraging the new technology, the price of oil, the deliberate transitioning of the fleet, etc. I don’t think anyone is anticipating replacing the existing fleet with electric cars priced at the current level. Most expect that the prices will drop dramatically with production rates. This happened with the Japanese hybrid technologies and is likely to happen with the full electric versions (see what China will do). But with this is the case, these are serious issues that are not traversed by the rather superficial discussion of the future of the electric car, something that is tackled in the literature and could be referred to. Another omission has to do with balance of payments for oil and security of supply for transport.
Page 7, Line 342. Space between “linearly” and “into”. Why should it be linear? Amongst other factors this assume oil prices remain competitive? In the long run, this assessment that emissions need not reach the levels that many anticipate in the literature for developed nations- that is approaching zero by 2050. Now you need not accept this, but you need to have clear argument why or how that risk might be managed.
Page 8, Line 358. Space between “suggests” and “that”.
Page 8, Line 361. Data from the vehicle fleet statistics. What statistics, where available??
Page 9, Line 371-375. Space between “been” and “studied”. Why weren’t these studies (and others) more widely integrated into the dialogue about the future of cars? The conclusion that is drawn is not at all convincingly bases on the evidence presented. The comment on trucks is not borne out by emerging market trends elsewhere.
Page 9, Line 379-380. Space between “in” and “towns”. Again the use of Wikipedia?
Page 9, Line 387-388. Space between “patterns” and “of”. Space between “10%” and “by”.
Page 9, Line 391. “percent” in this line, “%” elsewhere. Be consistent.
Page 9, Line 395. Space between “abandons” and “a”. More “advanced” meaning what, how?
Page 9, Line 387-388.
Page 9, Line 399. “Dominion Rd LRT” meaningless to many readers. Too parochial.
Page 9, Line 402. Only true if cost effectiveness excludes all other dimensions of cost to the community.
Page 10, Line 412-413. Space between “declined” and “from”. Yet again Wikipedia??
Page 10, Line 422. Space between “lessons” and “from”, “overseas” and “must”. Space between “revalued” (sic) and “in”.
Page 10, Line 430. 150 PJ per year.
Page 10, Line 437. You must explain the relevance that you have studies the UK and indeed where those studies are recorded in the peer reviewed literature. Unpublished is simply, not acceptable.
Page 10, Line 448. Data is plural so “data are”.
Page 11, Line 457. The impost of tightening regulations on the efficiency of white goods had a significant impact on emissions in Australia.
Page 11, Line 470. Space between “abandons” and “a”.
Page 12, Line 504. Yet again Wikipedia??
Page 12, Line 506. Space between “services” and “and”.
Page 12, Line 507. We all know the NZ economy is small. So what is the relevance of this comparison?
Page 12, Line 513-516. Space between “describes” and “itself”. One would need to be very careful that the anticipated growth in rural production addresses the issues raised in the point on Page 5, Line 208.
Page 12, Line 518-519. Yet again Wikipedia?? Why italics for “growth”?
Page 12, Line 522. Space between “food” and “(FAO”.
Page 12, Line 528-538. GHG needs to be defined. Why italics for “intensity”? Space between “emissions” and “from”.
Page 12, Line 542-543. Note “et al.” Period. Source of these data?
Page 13, Line 547-557.The are very bold statements that are not supported by citations of relevant studies and in any case are open to significant debate and questions. All this text suggests is that this is something author knows very little about.
Page 13, Line 562-563. Note “et al.” Period. Why define GHG here after its wide use earlier??
Page 14, Line 581-589. There is a huge literature on the control of enteric emissions from cattle. Again this text suggests is that this is something author knows very little about and is influenced by just a small sample, albeit relevant, of the literature.
Page 14, Line 598. Note “et al.” Period.
Page 14, Line 611. There is a need to define “marginal land”. One stand point is to assume that no land is marginal because it is occupied by and ecosystem that itself has intrinsic value. Isolating it for another purpose requires a rigorous assessment of whether these intrinsic values are outweighed by the value of the new proposed use.
Page 15, Line 664. “book-kept”?
Page 15, Line 671. “The trend data are..”.
Page 16, Line 701. “on” not “of”.
PART 3: The Response of the Journal of New Zealand Studies
After a six-month delay:
First of all, I apologise for the delay in reaching a decision on your article: we had to wait for the peer reviews and they took some time to arrive.
I regret very much that the journal is unable to accept your article for publication. The peer reviews identify similar fundamental problems relating to structure, analysis, accuracy, source material and referencing, and neither recommend acceptance by the journal.
Thank you for sending the article to the Journal of New Zealand Studies,
Editor.
Peer review 1
I have read the submission but to save myself from wasting any further time I would point out the sentences towards the end of the paper “Most research has focussed on the possible long-term downsides of more CO2 in the atmosphere, but there are real-world upsides of increased atmospheric CO2 in the here and now” And “The chances of a CO2 induced atmospheric thermal runaway can be discounted, as the more extreme atmospheric conditions of the past failed to induce such a runaway. The present hiatus in temperature rise since 1998 while CO2 emissions have gone on increasing is prima facie evidence of some such moderating feedback – the longer the hiatus continues post the El-Nino event of the last two years, the more urgent the real understanding of this effect on future climates will become (APS 2014)”. This is just not true: see for instance many of the papers by Jim Hansen. The so called “hiatus” has been discounted by recent temperature rises and this alone should prevent publication of the paper.
The paper itself is poorly written from a technical point of view and has poor referencing using a lot of web sources and dodgy sites. I checked one of the data sets on vehicles and found it in error. The analysis of RE for NZ is not correct and poorly referenced. I am afraid could not recommend the paper in any way.
Peer review 2
This manuscript contains many unsupported or weakly supported assertions. Its style often turns to advocacy. For example, having argued that New Zealand’s emissions are an order of magnitude or two smaller than China’s, the author asserts that “A sense of this reality must be reflected in decisions on taking actions to mitigate New Zealand emissions.” His advocacy of a New Zealand policy stance thus rests on the comparative size (absolute emissions) of the two economies. It could equally be argued that per capita GHG emissions are more relevant: using this latter metric as a guide would suggest that New Zealand has a more immediate responsibility than China in terms of the need to reduce emissions, and there is a case for New Zealand’s mitigation actions reflecting this reality.
The manuscript is also replete with typographical errors and other mistakes – such as Sim instead of Sims (at line 33) – and misspelt and inadequate references (e.g. to Mackinsey 2010).
The sourcing and referencing is selective. For example, the para from line 83 heavily relies on BP data, whereas many others would contest BP’s forward projections. Moreover, McKinsey’s work (already mentioned) is itself not well referenced and peer reviewed so is not a reliable guide to use.
The purpose of the manuscript seems to be to check policy over-enthusiasm by triaging policy options suggested by a report of the RSNZ (2016), using a cost-benefit analysis. This might be a reasonable approach if used with humility about the technique or approach. However, the author does not apparently consider the limitations of such a technique, and the paper has a ring of tendentiousness throughout. Moreover, the analysis typically neglects the co-benefits which may go with transformational changes such as mode changes in the transport sector. For example, at Line 389, it is stated that ‘…there may be good reasons to increase public transport, but it is simply not a cost-effective way of reducing carbon dioxide emissions.’ But if the co-benefits of increasing public transport are taken into account, then the benefits would in many cases outweigh the costs, making such an investment a cost-beneficial way of reducing emissions.
The manuscript also seems committed to dismissing the “notion of zero global carbon emissions by 2050 in the face of this real world evidence….” (line 96). Yet the IEA has argued that net zero by only a little later — 2060 — is feasible, if difficult. It is notable that the manuscript does not review the range of published articles/conclusions on this matter (e.g. Ramanathan, Molina, & Zaelke, 2017; Xu & Ramanathan, 2017), some of which argue that achieving net zero by 2050 is feasible, and take a risk/uncertainty oriented approach, but instead relies on the view of BP.
The manuscript argues that a speculative CCS price of GBP 20/tCO2 by 2025 should be used as a benchmark value for comparing with various abatement options. It is poor policy to use a speculative value as a benchmark, as there is a significant risk that the value will turn out to be too optimistic (low), and the associated consequences of delayed action (with associated negative impacts) could be highly adverse.
The manuscript contains several examples of weak logic. It is stated in the discussion of electricity generation: ‘Note here that wind and solar renewables are not needed to play a role in meeting the target’ [of 90% of electricity from renewables]. This is an odd inversion of logic: it would make sense to bring wind and solar into the system for any carbon cost up to at least a conservative estimate of the social cost of carbon (estimated by various studies at around NZ$50 – 200/tonne). At the higher end of this range, a great deal more solar and wind would be commercially generated, taking NZ well over 90% renewable. To say, as the manuscript does, that new wind farms have been stalled over the last five years is to ignore the fact that a key reason for this is the low carbon price produced by the ETS.
The section on walking and cycling infrastructure is poorly constructed, and does not warrant further comment. The author is poorly informed about this area.
This manuscript is so poorly constructed and argued that it does not warrant publication in its present form.