
 New Zealand’s so-called home ownership crisis has become a political bandwagon that everyone seems to be jumping on. It is based on Statistics New Zealand Census data that shows home ownership rates have been falling over recent years from 73.8 percent of total households in 1991, to 70.7 percent in 1996, to 67.8 percent in 2001, and to 66.9 percent in 2006.
Socialist groups in particular are using the figures as a clarion call for redistribution on a grand scale – a multi-billion dollar taxpayer funded spend-up in the form of government home-building programmes to fast track low income families into their own homes.
The Labour Party wants the government to build 100,000 new “affordable” homes at a rate of 10,000 a year over a 10 year period. They claim that their homes could be built for $300,000 and would be offered to low income families to buy – using a ballot system if the demand exceeds supply.
The Greens want the Government to do more – not only build 100,000 new “affordable”, “healthy”, “warm”, “environmentally-friendly” homes, but fund them as well. These homes would be offered to families under an equity-sharing scheme, meaning that taxpayers would carry the full $300 billion cost burden of private home ownership debt. This debt would be paid off over a 25 year period, according to the Greens’ best-case scenario, but the timeframe would be decades longer, if families opted to pay the minimum of $100 a week off their low-rate $300,000 government loan.
In spite of being a so-called “movement of the people”, the Mana Party’s core principle is that “what is good for Maori is good for Aotearoa”. Their plan for affordable housing is predictably race based: 10,000 houses a year built only by Maori, only for Maori, and which can be on-sold only to Maori. The estimated $200,000 cost of these homes would be funded by all taxpayers, with successful Maori recipients paying no deposit and being charged low government interest rates.
These policies to provide low cost housing to first home buyers are based on the apparent declining rate of home ownership in New Zealand. But party policy analysts clearly haven’t delved into the robustness of the figures upon which they are making their multi-billion dollar promises. Those who have investigated Statistics New Zealand’s housing tenure Census data are concluding that the claims that home ownership rates in New Zealand are in decline, could be wrong.
When it comes to “official” data collection and interpretation, Statistics New Zealand is no stranger to controversy. Even when their figures convey false impressions that lead to misguided public policies prescriptions, it is not easy to bring about change.
One long-running controversial example of Statistics New Zealand data conveying false impressions is the Household Labour Force Survey. The HLFS is a quarterly survey that samples 15,000 households during a reference week, asking residents about their employment status. The results are touted as the country’s “official” record of employment and unemployment. The problem is their methodology: people who are officially unemployed but not looking for work – or not available for work – are not counted as being unemployed. Instead they are labelled as ‘jobless’ and excluded from the unemployment figures. Similarly, anyone who is officially unemployed but who worked for one hour, in either a voluntary or a paid capacity, during the survey week is counted as being employed – even if their one hour of voluntary work was the only time they ‘worked’ during that three month period.
As a result of these anomalies, governments are tending more and more to use the unemployment benefit figures as a clearer indication of what is going on, even though not everyone who is unemployed is on a benefit.
Another example where the statistics are misleading – with extremely serious public policy implications – relates to ethnicity. Statistics New Zealand counts everyone who indicates on their Census form that they have a smidgeon of Maori blood, as Maori – even when their predominant ancestry is some other ethnicity. As a result the ‘official’ size of the Maori ethnic group is significantly overstated.
This issue has long been the subject of challenge. When Simon Chapple was a Senior Research Analyst with the Department of Labour in 2000, he outlined the problem in a groundbreaking report on Maori socio-economic disparity: “Currently Statistics New Zealand’s official policy is to arbitrarily classify mixed ethnicity individuals who have Maori as one of their ethnic groups as Maori and not as the other group or groups to which they also belong.”1
He warned, “Social scientists and policy makers need to be more aware that Statistics New Zealand’s arbitrary classification may confuse analysis if it is taken literally”.
He suggested a solution: “A random statistical allocation of half of mixed Maori/non-Maori to the Maori ethnic group and half to the non-Maori ethnic group is a more intellectually appealing solution to the taxonomic problem of mixed ethnicity people than calling them all Maori. This solution still does some – but surely much less – violence to people’s subjective choice to indicate they belong to several ethnic groups. The solution also guards against some of the more egregious perceptual and analytical errors arising from the current taxonomy.”
In other words, he suggested that rather than classifying everyone who mentions on their Census forms that they have mixed Maori ancestry as being a member of the Maori ethnic group, a more accurate methodology would be to classify only a half of them to the Maori ethnic group, with the other half allocated to their main non-Maori ethnic group. The fact that such changes have not already been made is an indictment of those politicians and officials charged with providing accurate statistics on which to base public policy, since overstating ethnicity data has profound implications, not only in terms of public funding for Maori-based initiatives, but also in the crucial population calculations for Maori seats.
But back to the issue of home ownership. The problem in this case is that Statistics New Zealand has failed to adequately account for the growing trend over recent years for families to place their family homes into family trusts. Although questions were finally asked about family trusts in the 2006 Census, they were inadequately framed and produced inconclusive data. That means the Statistics New Zealand claim that home ownership rates in New Zealand are in decline, is unreliable.
This week’s NZCPR Guest Commentator is Michael Littlewood, the Co-director of the Retirement Policy and Research Centre at Auckland University. In May, the Centre published a paper, PensionBriefing: Census 2013 – shortcomings in questions about housing, which challenges Statistics New Zealand’s findings about declining home-ownership trends. They found that of the 1,613,451 dwellings in New Zealand in 2006, the ownership status of 19.4 percent of them – almost 1 dwelling in 5 – cannot be accounted for. Further, with family trusts becoming increasingly popular, and the Census questions failing to adequately provide reliable data, the accuracy of the Statistics New Zealand claim that home ownership is in decline, is being challenged.
In his NZCPR commentary – which provides a synopsis of the briefing paper – Michael Littlewood explains that given the serious gaps in the data on the ownership of dwellings, a more reliable estimate of home ownership trends might be found by examining the number of people who are renting. Clearly, if Statistics New Zealand is right and home ownership rates are in decline, then the number of people who are renting should be increasing. However, the data has remained relatively stable over the last 30 years:
“If rent-payers have no connection to the owners, home ownership rates may possibly be deduced from the numbers of households who say they are paying rent and who specify the amount paid. Rent payers were 49.3% of occupants in the 1936 Census – the proportion has about halved over the following 70 years. However, of particular note is that the proportion of rent-payers has been relatively flat over the 30 years 1976-2006, as the chart shows:
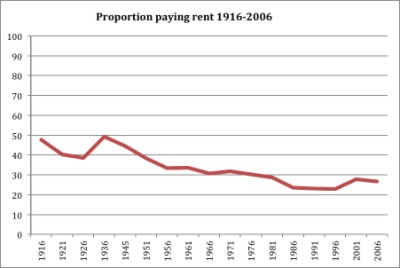 “It seems difficult to construct a story about falling home-ownership rates from this chart. If home-ownership rates were really falling, we should expect rising, rather than relatively flat rent-paying occupancy rates over the 30 years between 1976 and 2006. Rent-payers were 30.3% of occupied dwellings in 1976. Since then, rent-paying rates ranged from 22.9% to 28.6%. The 2006 rate was at the mid-point of the 30-year range of+3.6 percentage points.”
In questioning the reliability of the data that underpins claims of declining home ownership in New Zealand, Michael Littlewood and his team are doing the country a great service. Billions of dollars of public money has been promised by opposition parties to build affordable homes to arrest the reported downward trend in home ownership. If, as seems likely, the trend is not downwards at all, but may even be upwards, these policies will be seen to be redundant.
The National Party’s approach has been to focus on the more urgent problem of housing shortages and rising prices in some of our key cities, namely Auckland – and of course Christchurch. They are attempting to address the causal factors: a scarcity of land on which to build new homes, excessive delays and charges due to the Resource Management Act and local government administration, and the rising cost of construction.
Their solution has been to propose new Housing Accords in areas where there is a significant problem so that housing construction can be fast-tracked and costs cut. As a result of such an Accord in Auckland, they hope to streamline administration so that 39,000 new house consents can be issued over the next three years. In addition they are tackling the high cost of construction, not only through cutting red tape and regulation, but through productivity improvements in the building sector and reduced delays.
In conclusion, the political panic over falling rates of home ownership is based on figures that cannot be relied upon, with home ownership rates probably not in decline at all. The concerns over housing affordability are concentrated in just a few centres around the country, where population increases have outpaced the building of new houses. In many other parts of the country, low income families looking to buy their first home have plenty of affordable houses to choose from – especially if they make use of KiwiSaver.
In the year to March, some 10,733 KiwiSaver members drew on their savings to put a deposit on their first home – up from 5,727 last year. Members who have been in KiwiSaver for three or more years are able to use their savings contributions as a deposit on a new home – topped up with a government subsidy of $1,000 for each year they have been enrolled in the scheme, up to a maximum of 5 years. That means that on top of their KiwiSaver savings, a couple can receive a generous government contribution of $10,000 towards their deposit.
While most New Zealanders will applaud the government’s focus on making it easier and cheaper to build a new home, many others will be wary of political plans for massive government home-building schemes – especially when claims of falling rates of home ownership look to have been seriously overstated.
- Simon Chapple, Maori socio-economic disparity ↩