
 With net migration predicted to exceed 40,000 this year, immigration is shaping up to be a key election issue. The turnaround in migration numbers is not being caused by a blow-out in the number of non-New Zealanders entering the country, but rather by fewer Kiwis departing for Australia and more coming home. Of the more than 1 million New Zealanders who live overseas, almost half live in Australia.
In the financial year to the end of June 2013, New Zealand had a net migration gain of 7,900 people – up from a net loss of 3,200 people in 2012, and a net increase of 3,900 in 2011.[1] It was made up of 88,200 arrivals and 80,300 departures. Of the arrivals, 24,700 were New Zealanders returning home and 63,500 were non-New Zealanders coming here for jobs, family reunification, or under refugee and treaty arrangements. Of the departures, 56,500 were New Zealanders leaving the country (77 percent bound for Australia) and 23,900 were non-New Zealanders.
In terms of short term arrivals, there were 1,450,000 overseas visitors, students and workers, along with 826,000 Australians. Excluding Australia, the top five countries for visitors were China, the United States, the United Kingdom, Japan and France.
A total of 38,961 people were approved for residence in the year ended June 2013. Many started out on a temporary basis as students or workers. Around 20,000 were approved through the Skilled/Business Stream, 15,600 through the Uncapped and Capped Family Streams, and 3,200 through the International/Humanitarian Stream, which includes the Samoa Quota of 938 places, the Pacific Access Category of 431 places, and the Refugee Quota of 1,073 places.
India has taken over from the United Kingdom as the largest source country of Skilled/Business Stream migrants at 18 percent, followed by the UK on 16 percent, the Philippines on 11 percent and China on 10 percent. In the family categories, the largest source countries were China, the UK, and India, and the largest proportion of approvals in the International/Humanitarian stream, were from Pacific countries.
At the present time, net migration is rising rapidly, largely caused by the deteriorating economic outlook in Australia and improving employment opportunities here. In the Budget documents, Treasury suggested that stronger migration could result in a peak of 41,500 by December – before settling back to the 20 year long-run average inflow of 11,700 a year. They said that while this would create stronger domestic consumption and investment growth, it would also put pressure on housing supplies in Auckland in particular. However, since many of the New Zealanders who go to Australia, move from the provinces, a considerable proportion of those returning, are likely to move back to their home town – at least initially.
Politically, immigration has always been the domain of the New Zealand First Party. Without fail, in the run-up to a general election, Winston Peters’ anti-immigration rhetoric grabs the headlines. It is to be expected. It is one of those populist issues that Mr Peters knows will attract attention and motivate voters.
This time around, with Labour struggling to reach 30 percent in the polls, leader David Cunliffe is also playing the immigration card. He stated that net migration of over 40,000 was too high and that cuts were needed. Ironically, Mr Cunliffe was Minister of Immigration around the time that net migration reached a record level of 42,500 in 2003. In that case, a key driver of fewer New Zealanders leaving the country and more returning home, were growing international concerns over safety and security, following on from the 2001 September 11 terrorist attacks on the World Trade Centre in New York.
The problem for Mr Cunliffe is that immigration is an extremely sensitive issue. He suggested that net migration should be cut back to “between 5,000 and 15,000”, but when questioned as to which migrant categories he planned to slash, he ruled most of them out, clearly not wanting to upset any migrant groups! Quite what his policy is now, nobody really knows, although something more considered is likely to be revealed during the election campaign.
New Zealand is an immigrant nation, with almost a quarter of all residents born overseas. As the Prime Minister put it, “Everyone’s a migrant pretty much of some sort”.
This week’s NZCPR Guest Commentator, Brian Gaynor, the Executive Director of Milford Asset Management and a long-time Herald columnist, has done the numbers:
“The 2013 Census figures show that overseas-born New Zealand residents now represent 23.6 per cent of the country’s total population, compared with 21.8 per cent in the 2006 Census and 18.7 per cent in the 2001 Census. These figures are extremely high by international standards. The United States has only 12.9 per cent of its population born overseas and has never had more than 14.8 per cent since the country’s 1850 Census. The latest United Kingdom Census showed that 7.5 million individuals, or 13 per cent of the population, were born in other countries. Australia, with 27 per cent of its resident population born offshore, is one of the few countries with a higher overseas-born to total population ratio than New Zealand.”
The mix of overseas-born New Zealand residents is changing: “Individuals born in England, Scotland, Wales and Ireland now represent 26.5 per cent of the country’s foreign-born population compared with 32.2 per cent 12 years ago, while Pacific peoples now account for 15.1 per cent compared with 16.9 per cent in 2001. Meanwhile, China-born residents have risen from 5.6 per cent to 8.9 per cent of the foreign-born population, Indian-born from 3.0 per cent to 6.7 per cent, and Philippines-born from just 1.5 per cent to 3.7 per cent.
In comparison, “The most important countries of birth for Australia’s overseas-born residents are Britain, with 20.8 percent; New Zealand with 9.1 percent; China with 6 percent; and India with 5.6 percent.”
Whether we like it or not, given the propensity of New Zealanders to spend some time living and working overseas, immigration is changing our ethnic mix. The big question is whether we embrace it or deny it and try to restrict migration to ‘compatible’ races.
Many would say that globalisation is an unstoppable trend and that major benefits flow from the international merging of trade, work, and culture.
Others, however, would prefer migrants to come from countries with similar cultures. They worry when they see mosques being built, women wearing burqas, or when they encounter people who struggle to speak English. While they accept the right of immigrants to retain their own beliefs and practices, they nevertheless want them to respect our culture and fit in – to regard themselves, first and foremost, as New Zealanders.
These concerns are not isolated to New Zealand, of course. The debate over integration versus assimilation is taking place world wide. On one hand is the concept of multiculturalism, where different cultures co-exist side by side, each retaining their own separate identity, creating parallel societies. While on the other hand is the traditional view that nations can only function cohesively if all the different groups within a multiethnic society assimilate and adapt to the cultural values of the society at large, working together in the national interest.
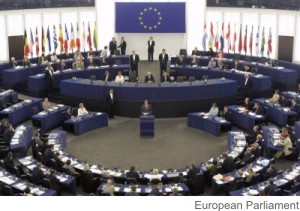
In some countries, like those in the European Union, these issues have become highly politicised. Last month’s elections for the European Parliament – which is made up of 751 members representing over 500 million citizens in 28 European Union member countries – showed this only too clearly. To the surprise of many, a preponderance of right-wing Euro-sceptic parties preaching anti-immigration rhetoric, were elected – in some cases, outpolling mainstream parties.
In France, the protest vote went to the National Front, which won the election with 25 percent of the vote to gain 24 seats. In Britain, the UK Independence Party defeated Labour and the Conservatives, winning 24 seats. In Denmark, the anti-immigration Danish People’s Party, which campaigned on reclaiming border controls and curbing benefits to other EU citizens living in Denmark, won the election with 26 percent of the vote to gain 4 seats. In Italy, the anti-establishment 5 Star Movement won 17 seats. In Holland Geert Wilders’ Party for Freedom won 4 seats, Greece’s radical Golden Dawn won 3 seats, the right wing Sweden Democrats 2 seats, the neo-Nazi German National Democratic Party one seat, and so on.
In some countries the protest vote swung to the left – in Greece, the Coalition of the Radical Left, Syriza, won the election with 26 percent of the vote and gained 6 seats, and in Ireland Sinn Fein secured 3 seats.
The anti-immigration protest is largely against open border policies, where European Union member countries must allow the free movement of labour. With the various EU countries now having vastly differing living standards, the flow of labour from poorer countries to richer countries is resulting in jobs being taken by foreign workers and new immigrants accessing welfare benefits.
The situation in New Zealand, where we control our own borders, highlights the advantage of being a sovereign nation!
With our general election only a few months away, the results of the European Parliamentary elections also enables us to look at some of the wider issues relating to voter behaviour.
Firstly, the elections were dogged with a poor voter turnout of only 43.09 percent, just marginally above the 43 percent turnout in their last elections in 2009, and well below the first European parliamentary elections in 1979, where almost 62 percent of those eligible voted.
The poor voter turnout has been blamed for the strong showing of the more radical parties – while disaffected protest voters turned out in force, more moderate voters stayed at home.
The best performing nations in the election were Belgium and Luxembourg, with a voter turnout of 90 percent. This is not surprising considering that voting is compulsory! However, with voting also compulsory in Greece, where only 60 percent voted, and in Cyprus, where the turnout was only 43 percent, the notion that making voting compulsory will fix the problem of low voter turnout, can be dispelled. [2]
The worst performing nations in 2014 were Slovenia, where only 13 percent voted and the Czech Republic on 19.5 percent.
Estonia moved to e-voting a decade ago, but in spite of advocates of electronic voting saying it would increase voter participation, voter turnout dropped from 43.9 percent in 2009 to 36.4 percent.
Another interesting case is Austria, which in 2007, became the only EU country to lower the voting age to 16. Proponents claimed that allowing young people to vote would raise overall voter participation rates, but the voting figures show a slight decline in voter participation from 45.97 percent in 2009 to 45.7 percent. The breakdown of data on the youth vote is not yet available.
Finally, a comment on voting thresholds: following a decision by the German Constitutional Court in 2011, that the 5 percent threshold for European Parliamentary elections disadvantaged small parties and was unconstitutional, it was reduced to 3 percent by the German Parliament (which retains a 5 percent threshold). However, the Court ruled the new threshold hurt the equal opportunities of parties and removed it altogether. As a result, while Germany had seven parties elected to the European Parliament in 2009, it now has 15, with seven of them – including the neo-Nazi German National Democratic Party – having only one member. In other words, concern that removing the threshold would undermine political stability, through fragmentation and the rise of radical parties, has indeed been borne out.
THIS WEEK’S POLL ASKS:
Are you concerned about the level of immigration in New Zealand? If so, what are your concerns?
Click HERE to vote
Click HERE to see all NZCPR poll results
FOOTNOTES:
1. Euronews, 2014 European elections: 43.09% – achievement or failure?
2. Ministry of Business, Innovation and Employment, Migration Trends and Outlook 2012-2013.