
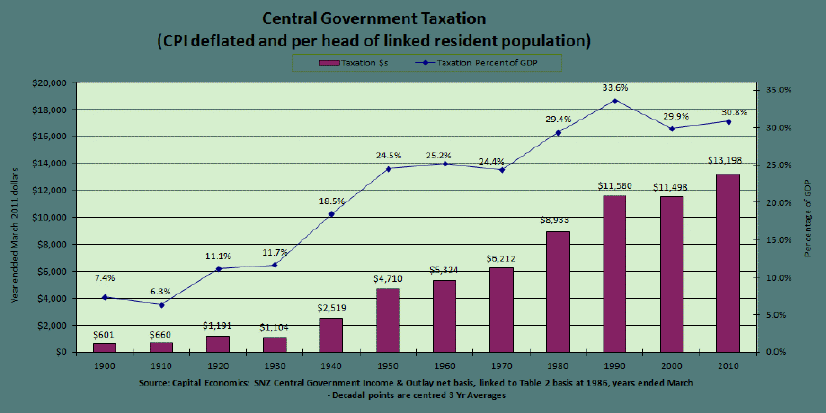
During the last hundred years central government taxes per capita rose 20 times faster than consumer prices (from around $660 in 1910 to $13,198 in 2010 in year ended March 2011 dollars, as in the chart below). Meanwhile real GDP per capita only rose roughly 4-fold. The fact that taxes rose roughly 5 times faster than incomes as measured by GDP is reflected in the rise in taxes as a percentage of GDP from 6.3 percent of GDP in 1910 to around 30.8 percent in 2010.
The timing of the major increase in the burden of taxes on New Zealanders is informative. Real taxes per capita almost doubled (permanently) during the decades in which World Wars I and II occurred. They more than doubled again in the decade of the 1930s – which encompassed the Great Depression. Increases in taxes per capita more or less matched the increase in GDP per capita between 1950 and 1970, with the tax revenue ratio being of the order of 24-25 percent of GDP. The next 20 years saw another big lift in real taxes per capita, both absolutely and relative to GDP. High rates of inflation drove taxpayers up the progressive tax rate scales during this period. The decade of the 1990s provided some respite in that it was the first since the 1920s on this dataset in which taxes per capita did not rise between the beginning and end points. The last decade has seen another big increase.
Taxes alter behaviour at the margin in undesired ways. An income tax encourages people to spend less time earning a taxable income and more time on leisure and home improvements. Income taxes also discourage savings because of the double taxation element. Taxing the inflation component of the return on savings heightens this problem. When a small country taxes income earned by non-residents in New Zealand, the cost of capital to finance expansion goes up for all New Zealanders. Lawyers and accountants benefit from their client’s search for ways of sheltering income from income tax, but New Zealanders as a whole do not. Indirect taxes on goods and services avoid the double taxation of income from savings and should help reduce the cost of capital to New Zealanders to the extent that they substitute for tax on non-residents’ income earned in New Zealand. But they discourage employment by inducing people to find non-taxed ways of consuming, such as home production and direct imports.
Other problems arise from the interaction between inflation and the tax system, including the difficulty of defining and measuring income when the price level is changing and/or when assets are hard to value. Taxing people on inflationary capital gains that they have not realised could cause real hardship, particularly to capital intensive activities such as family farms. There are also difficulties in defining the tax base for indirect taxes. Interactions between income-tested benefits and the tax system can also create intolerably penal effective rates of tax on an extra dollar of income for some beneficiaries. State induced benefit dependency can be expected to weaken the work ethic, work skills, personal morale and life expectancy of those that become trapped by it. A 2010 paper by Inland Revenue and the Ministry of Social Development reported (at page 9) that 11 percent of the 357,200 families in the Working for Families scheme faced effective marginal tax rates of 75 percent or more. For 2 percent of families the effective rate exceeded 100 percent.
Economists have shown using the most simplified theory of supply and demand, primarily, narrowly focused on the substitution between work and leisure that it costs the community more than a dollar to raise a dollar in taxes. Moreover, the additional cost rises sharply with the rate of tax. To be specific it is likely rise roughly with the square of the effective tax rate on the marginal dollar. Double that tax rate and the effective cost to the community of raising that revenue roughly quadruples. Raising the tax revenue necessary to fund a given level of government spending requires a higher tax rate the narrower the base level for taxable income or spending. This is an argument for raising the required tax revenues by applying a relatively low average and marginal tax rate to a broad base of taxable income or spending.
This adverse hidden effect of taxes is in addition to the more familiar effects of administration costs, enforcement costs and compliance costs, such as the costs of hiring accountants and consulting tax lawyers.
It is also additional to the similar effects of government entitlement spending programmes that induce people to alter their behaviour in order to take advantage of the benefits offered by such programmes, while avoiding the costs. The clustering of the retirement age around the age at which taxpayer funded age benefits become available is an example of this effect.
Unfortunately, there is no accurate way of estimating the overall unintended cost to the community at the margin of the current (or any other) tax structure. Treasury suggests that estimates of the cost to the community of an extra dollar of tax-funded government spending vary from $1.14 to $1.50 and suggests that as a result tax-funded public expenditures should be multiplied by a factor of 1.2 to estimate their cost to the community.
This factor could well be much too low. In the last 15 years economic research has concentrated on estimating the responsiveness of taxable income to changes in marginal tax rates. A high responsiveness is prima facie evidence that the tax system is distorting behaviour in an undesired manner to a significant degree, with adverse implications for community wellbeing (unless the value to the community of the spending is commensurately greater). For example, a more recent (2009) paper by Treasury finds much higher upper estimates:
“If the top tax rate is 0.4 and the ETI [ETI = elasticity of taxable income, which is a measure of the responsiveness of taxable income to the rate of tax]= 0.4 (a value that is suggested from studies of other countries …), the formula … gives a marginal welfare cost of 74 cents. This represents substantial inefficiency in raising tax revenue: for an extra dollar of tax revenue, obtained by raising the top tax rate, there would be an efficiency loss of 74 cents (representing the welfare loss over and above the extra revenue).”
(Greg Dwyer has drawn my attention to a 2012 article in the Journal of Economic Literature by Saez, Slemrod and Giertz, that has a lengthy technical discussion of the merits of this more recent measure of the unintended burden of taxes on the community. The article accepts the potential validity in theory of the measure, but emphasises the complexities of the issues and the degree of uncertainty that surrounds current estimates. One conclusion it draws is that taxes should be broad-based so as to reduce the scope for undesired substitution effects.)
Three conclusions can be drawn at this point:
- · the large increase in the per capita tax burden in the last century can be expected to have imposed large hidden costs on the community;
- · the spending increases funded by these tax increases can be expected to have made the community worse off unless their benefits were very significantly greater than the tax dollars spent;
- · governments should not increase tax burdens except for a good reason.
Spending just because economic growth is temporarily filling the tax coffers, because leading politicians want to mollify politically important constituencies and/or simply because they believe it is in a good cause do not constitute good reasons from the perspective of the well-being of New Zealanders overall.
So what sort of additional spending has been funded from this massive increase in the tax burden shown in the above chart?
A common assertion is that the current level of government spending is necessary in order to provide necessary public good infrastructure and a basic safety net. This is utterly wrong. In the early 1900s, New Zealanders were enjoying one of the highest incomes per capita in the world with government taxes of only around 6-7 percent of GDP. Today, the government statistician’s institutional accounts show that central government annual current consumption spending on goods of a collective nature is only 5-6 percent of GDP. Taxes are actually running 5-6 times higher than the amount required currently to fund activities of this type. The bulk of our taxes are actually going to fund social benefits and social assistance of a private good nature. Estimated spending of this nature by Statistics New Zealand amounted to 23 percent of GDP in the year ended March 2011. It was split almost evenly between benefits being provided in cash (such as welfare benefits and tax-funded superannuation payments) and benefits in kind, such as spending on health and education.
So how did New Zealand get into this situation?
Large permanent increases in welfare spending occurred between 1939 and 1950. The 1939 Social Security Act alone increased the annual rate of expenditure on benefits (mainly pensions) by 91 percent between the years ended March 1939 and 1941 and the number of beneficiaries by around 47 percent according to a year book at the time. Next up was the Social Security Amendment Act 1945 which increased the number on family benefit from 42,637 in 1946 to 230,021 in 1947. By 1950, real government spending per capita on cash welfare assistance, excluding war pensions, was four times higher than in 1939. In year ended March 2011 dollars, the increase was over $1,000 per head per annum. Not much changed between 1950 and 1970, but in the 1970s annual spending per capita on superannuation rose permanently by almost $1,500 annually, reflecting National’s big spending promise to win the 1975 election. The introduction under the Kirk-Rowling government of the domestic purposes benefit also swelled cash welfare spending, but this time on working age beneficiaries.
A further sharp rise in the welfare spending burden occurred in the 1980s, but during this period it was more focused on spending on working age beneficiaries in part through unemployment spending that reflected the serious economic mismanagement of the economy following the 1973-74 global oils price shock and up to the change of government in 1984. The Treasury’s long-term fiscal time series indicates that spending on social assistance, education and health rose by around 10 percent of GDP between fiscal years ended 1972 and 1990. In year ended March 2011 dollars it doubled during this period, adding roughly $4,000 per capita to the annual tax burden.
After a period of fiscal discipline in the first half of the 1990s, discipline increasingly weakened leading to the spending debacle of the 2004-2009 period. During this period, spending was increased much faster than the enormous increase in the per capita tax burden. The end of the revenue boom has seen New Zealand return to an outlook of prolonged fiscal deficits.
The following chart uses heavily smoothed series on current government outlays and tax revenues to put the 2011 problem into a longer historical context.
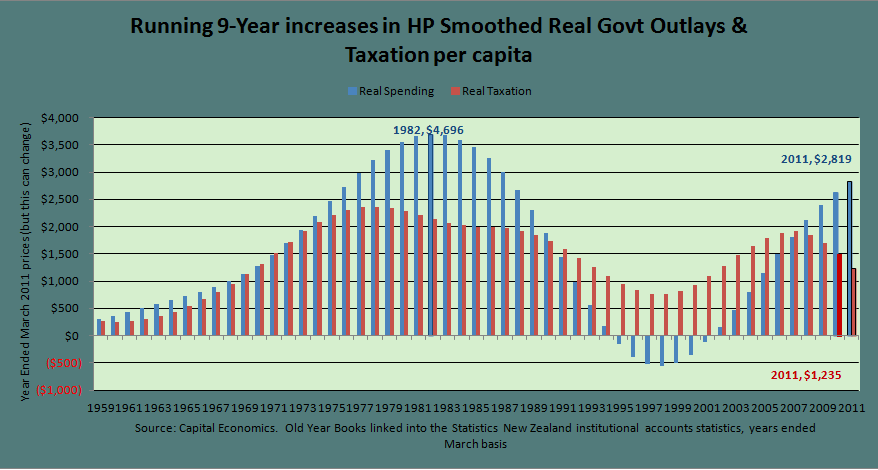
This chart uses a statistical technique called a Hodrick Prescott (HP) filter to smooth the annual real (CPI deflated) per capita central government outlays and tax revenues between 1950 and 2011 (years ended March basis). The filtering technique aims to identify trend changes rather than cyclical changes although it cannot hope to do so entirely satisfactorily, in part because of end point problems. However, it is desirable to try because tax revenues in particular are markedly cyclical.
The lines on the chart track the difference between smoothed real spending and taxation per capita in the displayed year and nine years earlier. The interval represents three parliamentary terms. For example, in the year ended March 2011, real current spending per capita was $2,819 higher in year ended March 2011 dollars (CPI) than in the year ended March 2002. Real tax revenues per capita were ‘only’ $1,235 higher. The rise in smoothed spending in the 2000s was reminiscent of the sharp rise in smoothed government spending in the second half of the 1970s, although there was much less excuse for it given that for much of the 2000s pressures on spending were reducing in respect of unemployment and the interest burden of the public debt. Two of the governments that were in office for three successive terms during this period ended up bequeathing large structural fiscal deficits to their successors.
New Zealand governments eschewed vigorous action on government spending until late 1984, and the chart illustrates the long struggle of subsequent governments was to achieve revenue increases that outstripped spending increases on a sustained basis. The degree of spending constraint between the years ended March 1986 and 1995 was such that the blue line actually went into negative territory for the first time, meaning that real per capita spending in the year ended March 1995 was actually lower than in 1986. Meanwhile real tax revenue per capita was almost $1,000 higher in the year ended March 1995 than in 1986. On a trend basis, the large fiscal deficits of the 1976-1984 period were largely closed by increasing revenue rather than by reducing spending.
The Christchurch earthquake and the global financial crisis and its aftermath continue to put upwards pressure on government spending and downwards pressure on revenue. The current government’s drive to limit the increase in spending while sustaining base spending, in conjunction with the weak economy and slumping productivity growth suggests another prolonged period of fiscal consolidation. The likelihood that a successor government would reopen the spending tap is another factor suggesting that eventual adjustment is more likely to be on the revenue side. The fiscal situation is not nearly as dire now as it was in 1984, but this is partly because the prices for exports in world markets relative to import prices have been at near record post World War II highs. It would be good if they stayed that way.
A potentially welcome development is the government’s intention to announce a cap on increases in government spending in this year’s Budget Statement. How effective that cap will be in increasing the credibility of on-going spending constraint will depend greatly on the details.